Understanding Solar-Terrestrial Data Banner by N0NBH and Band Conditions
I am sure that all of you who have visited qrz.com would have seen the Solar-Terrestrial Data Banner by N0NBH. I have also been seeing it for quite some time, but never bothered about it till the recent G5 Extreme Geomagnetic storm caused sudden radio blackout while we were having a nice round table chat on 7050 kHz at 6.55 am. I have seen the same banner from Paul’s website being displayed at many other sites, in different formats, courtesy, the script and links provided by him.
What you see here is a screenshot and not a live display and I am giving a brief description to make it easier to understand, though most of it is self explanatory. Date and time are displayed with time format as GMT which stands for Greenwich Mean Time also known as Coordinated Universal Time or UTC. UTC is also designated as Z or Zulu. Z stands for the Zero zone (GMT).
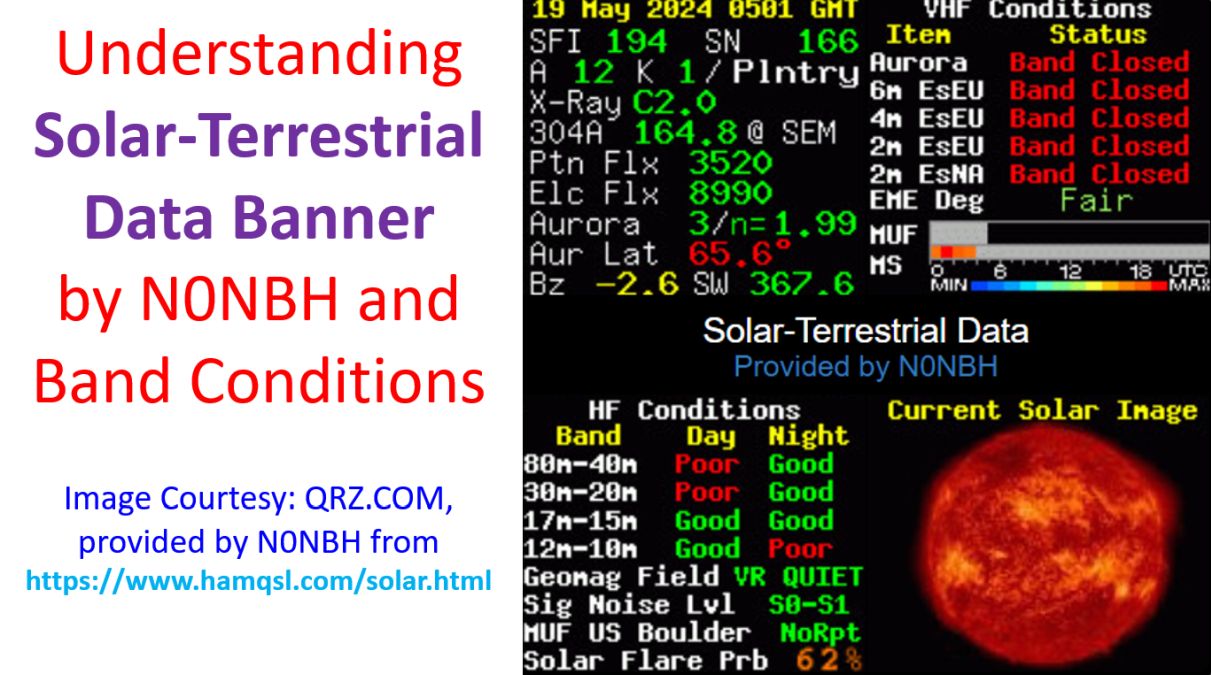
In this banner SFI 194 means Solar Flux Index is 194. SFI is the amount of solar radio noise measured at 2800 MHz and is updated daily. It indicates the status of the F layer of the ionosphere in supporting HF communication, with numbers below 75 quite poor and those above 160 very good for propagation, typically from 20 to 10m bands. Next to SFI is SN or the sunspot number which is also updated daily. It usually follows the SFI and is another indicator of ionization of the F layer. Here SN 166 is shown in green.
Next comes the planetary A and K indices. Planetary A index is known as Ap index and it is the daily average of long term stability of Earth’s magnetic field taken from several locations. It uses the average of eight 3 hour K index values. Planetary K index or Kp index indicates the short term stability of the Earth’s magnetic field. NOAA Space Weather Prediction Center updates it every three hours. It has a range from 0 to 9 and values above 5 are unfavourable for radio propagation. In the recent G5 geomagnetic storm, the value was 9. The image shown here has a Kp index of only 1, which is quite favourable.
Solar X-ray emission which impact the D layer of the ionosphere comes next. It is mentioned in classes A, B, C, M and X, with A being the lowest, and scales from 0.0 to 9.9. In the image shown it is C2.0. Stronger the radiation, lower the ability of radio waves to propagate by skywave refraction.
304A gives the relative strength of the solar radiation at a wavelength of 304 Angstroms (or 30.4 nm), mainly emitted by ionized helium in the Sun’s photosphere. Here it is shown as @SEM, meaning that it is using data from SOHO (Solar and Heliospheric Observatory) satellite using SEM or Solar Extreme Ultraviolet Monitor instrument. Other form of mesurement available is by the Solar Dynamics Observatory, using the EVE or Extreme Ultraviolet Variability Experiment instrument. 304A correlates with SFI and is responsible for about half of the ionization in the F layer of the ionosphere.
Next two values displayed are the Proton Flux and Electron Flux, reported by NOAA. Proton flux indicates the density of charged protons in the solar wind. Higher the number, more the impact on the ionosphere. Proton flux primarily impacts the E layer of the ionosphere. Electron flux is the density of charged electrons in the solar wind. Higher numbers have more impact on the ionosphere, that too primarily on the E layer.
Aurora data is calculated from hemispheric power value which varies from 0-150 GW to give the old scaled factor value from 0 to 10++. This indicates how strong the F layer ionization is in the polar regions. Higher values cause aurora to appear at more lower latitudes. Aurora Latitude is a calculated value from 67.5 to <45.0 which estimates the lowest latitude impacted by an Aurora event. This value is updated every 15 minutes and utilizes data from NOAA (National Oceanic and Atmospheric Administration of the United States of America).
Bz Component was from the Advanced Composition Explorer satellite which reports the strength and direction of interplanetary magnetic field as impacted by solar activity. Positive values are in the same direction as Earth’s magnetic field while negative values are of opposite polarity. Range is from +50 to -50. When the Bz component is negative, it cancels out Earth’s magnetic field and increases the impact of solar particles in the ionosphere.
Solar wind speed was reported from the same satellite, as per Paul’s website, though most likely both are from DSCOVR (Deep Space Climate Observatory) located at L1 point as NASA’s Advanced Composition Explorer was succeeded by DSCOVR after its launch in 2015. Higher solar wind speeds more than 500 km/s have impact on HF communications. If I remember correct, it was 700 km/s during the recent geomagnetic storm. Higher speed will also mean lesser lead prediction time after getting information from DSCOVR as it will reach Earth sooner from L1 position at around 1.5 million km from Earth.
Next comes the VHF conditions which are mostly self explanatory. If Aurora is reported as Band Closed, it means low or no auroral activity. High LAT AUR would mean Auroral activity above 60 degrees North latitude. MID LAT AUR would mean Auroral activity from 60 to 30 degrees North latitude. Es stands for Sporadic E propagation. EU stands for Europe and NA for North America. Each of the bands can be reported closed or open depending on the situation.
Earth-Moon-Earth Degradation reports EME path attenuation as Very Poor (>5.5dB), Poor (4dB), Moderate (2.5dB), Good (1.5dB), Very Good (1dB), Excellent (<1dB). Maximum Usable Frequency for Sporadic E propagation is presented in a colored bar. Gray for no Es activity, blue supports 6m, green supports 4m and yellow indicates 2m. Meteor Scatter Activity Bar also is seen as a colored bar showing activity with respect to time in UTC. Gray indicates no activity.
HF conditions by band and day and night needs no further explanation and so is the current solar image. Geomagnetic Field indicates how quiet or active the Earth’s magnetic field is based on the K index value. It may be reported as Inactive, Very Quiet, Quiet, Unsettled, Active, Minor Storm, Major Storm, Severe Storm, or Extreme Storm. Higher levels can cause HF blackouts and auroral events as experienced recently. Aurora was noted even in India at Ladakh, 34 degrees North.
Signal Noise Level is a calculated value which indicates how much noise in S units is generated by the interaction between the solar wind and the geomagnetic activity. More active and disturbed solar wind generates higher noise. Noise which one notices on the band is not just this, but includes many other types of noise. Even when this image showed S0-S1, I had noticed S9 noise in my radio on 40m! It will also depends on your attenuator and preamplifier settings. What this image shows is only the contribution to noise from solar wind.
Maximum Usable Frequency is an NOAA reported value from 0 to 100MHz. It gives the maximum usable frequency in MHz at one of 11 locations worldwide and the data is updated once in 15 minutes. Solar Flare Probability within next 24 hours is expressed in percentage from 0 to 100% and the data is from University of Bradford, updated every hour. I have tried to present what I have learned in a nutshell. Much more information and wonderful images are available at Paul’s website which you can go through in case you are interested in learning more.