
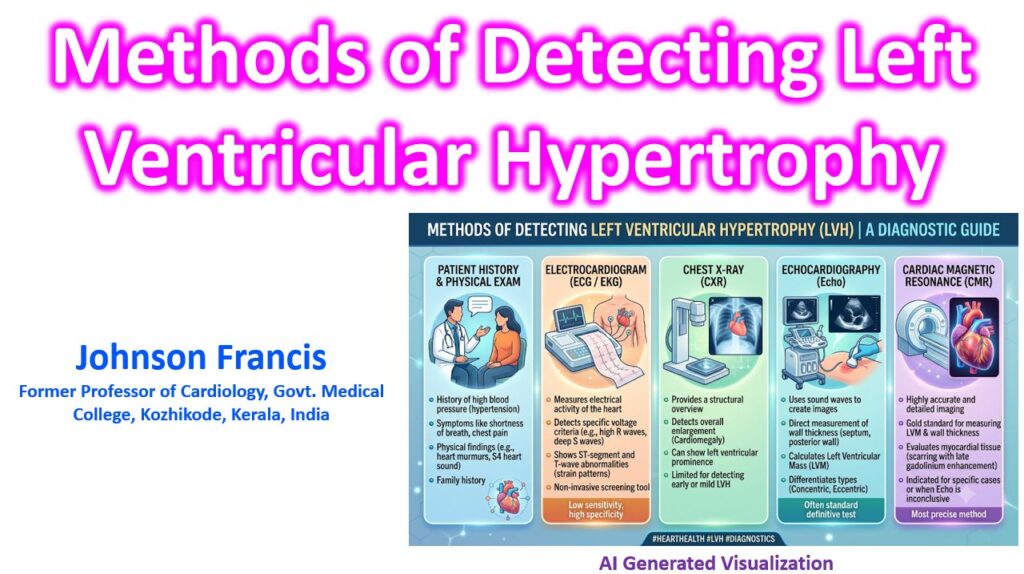

The detection of left ventricular hypertrophy (LVH) relies on a combination of electrical voltage criteria and structural imaging modalities. While electrocardiography serves as the primary screening tool, echocardiography and cardiac MRI provide definitive structural quantification and tissue characterization.
1. Electrocardiography (ECG)
ECG is the most accessible method but generally suffers from low sensitivity (typically 10–30%) despite high specificity (often >90%). Because standard criteria perform poorly in certain populations (like obesity), newer criteria have been developed to improve diagnostic yield.
| Criteria | Formula / Requirement | Notes |
| Sokolow-Lyon | SV1 + RV5 or V6 ≥ 35 mm | Classic but heavily influenced by body habitus and age. |
| Cornell Voltage | SV3 + RaVL > 28 mm (men) > 20 mm (women) | Adjusts for sex differences; generally higher sensitivity than Sokolow-Lyon. |
| Peguero-Lo Presti (2017, JACC) | SD + SV4 ≥ 28 mm (men) ≥ 23 mm (women) | SD = Deepest S wave in any lead. Offers higher sensitivity than older criteria. |
| Romhilt-Estes Score | Point system (≥ 5 points = definite LVH) | Incorporates voltage, ST-T wave abnormalities (strain), left atrial enlargement, and axis deviation. |
2. Echocardiography (TTE)
Transthoracic echocardiography is the primary clinical modality for definitively diagnosing LVH, allowing for the calculation of LV mass and the categorization of ventricular geometry.
Diagnosis is based on calculating the Left Ventricular Mass Index (LVMI), typically using the linear method (Devereux formula LV mass = 0.80 (ASE-cube LV mass) + 0.6 g) based on 2D measurements of the interventricular septum (IVSd), posterior wall (PWd), and LV internal dimension (LVIDd) at end-diastole.
According to ASE/EACVI guidelines, the thresholds for LVH are:
- Men: LVMI > 115 g/m2
- Women: LVMI > 95 g/m2
Once LVH is identified, calculating the Relative Wall Thickness (RWT) determines the geometric pattern:
RWT = (2 x PWd)/LVIDd
- Concentric Hypertrophy: RWT > 0.42 (typically seen in pressure overload, e.g., hypertension, aortic stenosis).
- Eccentric Hypertrophy: RWT ≤ 0.42 (typically seen in volume overload, e.g., severe mitral/aortic regurgitation).
3. Cardiac Magnetic Resonance Imaging (CMR)
CMR is the reference standard for the accurate and reproducible assessment of LV mass, volumes, and systolic function. It relies on 3D data acquisition, eliminating the geometric assumptions required by linear echocardiographic measurements.
Beyond simply measuring mass, CMR is critical for tissue characterization to differentiate the underlying etiologies of the hypertrophy:
- Late Gadolinium Enhancement (LGE): Identifies replacement fibrosis. Patterns are highly specific:
- Hypertrophic Cardiomyopathy (HCM): Patchy, mid-wall LGE, particularly at right ventricular insertion points.
- Cardiac Amyloidosis: Diffuse, global subendocardial or transmural LGE, often with abnormal blood-pool kinetics.
- Fabry Disease: Mid-wall LGE typically localized to the basal inferolateral wall.
- T1 Mapping & Extracellular Volume (ECV): Quantifies diffuse interstitial fibrosis before focal scars appear on LGE. Markedly elevated ECV is a hallmark of cardiac amyloidosis.