
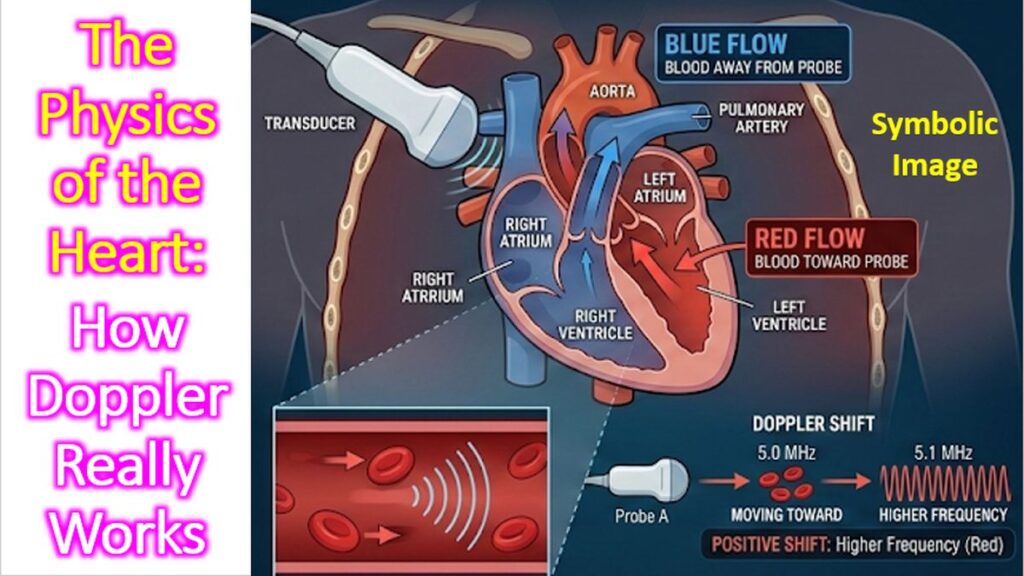

In clinical cardiology, Doppler ultrasonography is the application of the Doppler Effect—a shift in the frequency of a wave relative to an observer moving compared to the source. In the heart, the “moving objects” are red blood cells (erythrocytes). Understanding how this translates from a pitch change to a color map or a spectral waveform requires looking at the interplay of fluid dynamics and wave physics.
1. The Fundamental Equation
When an ultrasound transducer emits a pulse of frequency (ft), the beam hits moving red blood cells. The cells reflect the sound back to the transducer at a shifted frequency (fr). The difference between these two is the Doppler Shift (Δf).
The velocity of blood flow (v) is calculated using the following formula:
Δf = {2 * ft * v * cos(θ)}/c
Where:
- c: The speed of sound in human tissue (constant at approximately 1540 m/s).
- θ: The Angle of Insonation (the angle between the ultrasound beam and the direction of blood flow).
2. The Critical Role of the Cosine (cos θ)
In Doppler echocardiography, the angle is quite important.
- Parallel Flow (θ = 0°): cos(0) = 1. This provides the most accurate velocity measurement.
- Perpendicular Flow (θ = 90°): cos(90) = 0. The machine detects zero shift, even if blood is moving at high velocity. This is why sonographers always try to get “inline” with the flow (e.g., using the Apical 5-chamber view for aortic flow).
Note: If the angle exceeds 20°, the velocity error becomes significant. This is a common pitfall when assessing stenotic valves.
3. Spectral Doppler: PW vs. CW
The heart handles a massive range of velocities, from slow venous return to high-velocity jets in Mitral Regurgitation. To measure these, we use two distinct modes:
Pulsed Wave (PW) Doppler
- How it works: The transducer sends a pulse and waits for it to return from a specific depth (the “sample volume”).
- Strength: Spatial Resolution. It tells you exactly where the flow is occurring.
- Weakness: It is limited by the Nyquist Limit. If the blood moves too fast, the machine cannot sample quickly enough, leading to aliasing (where the peak of the waveform appears on the opposite side of the baseline).
Continuous Wave (CW) Doppler
- How it works: One crystal constantly transmits while another constantly receives.
- Strength: It can measure extremely high velocities (like those found in Aortic Stenosis) without aliasing.
- Weakness: Range Ambiguity. It measures all velocities along the entire length of the beam, so it cannot tell you exactly where the highest velocity is occurring.
4. Color Flow Mapping (CFM)
Color Doppler is essentially an automated form of Pulsed Wave Doppler applied over a large area.
- BART Convention: Blue Away, Red Toward.
- The Physics of Color: The machine assigns a color based on the mean velocity of the blood in each pixel. If the flow becomes highly turbulent (high variance), the colors mix into green or yellow, indicating a “mosaic” pattern often seen in regurgitant jets.
5. From Velocity to Pressure: The Bernoulli Equation
The primary reason we care about Doppler velocity in cardiology is to calculate pressure gradients. We use the Simplified Bernoulli Equation:
Δ P = 4v2
If you measure a peak velocity of 4 m/s across a stenotic aortic valve, the pressure gradient is 4 x (42) = 64 mmHg. This conversion is the backbone of non-invasive hemodynamic assessment.