Aortic stenosis – echocardiogram
Aortic stenosis – echocardiogram
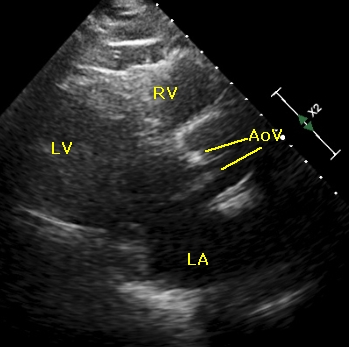
Aortic stenosis – echocardiogram: This is the parasternal long axis view which shows outflow region of the right ventricle (RV), interventricular septum (unmarked), left ventricle (LV), left atrium (LA) and the aorta. Aortic valve (AoV) is seen doming in systole, with a narrow orifice. The echo window is not very good in this case and the images are sub optimal. Usually in this view, the anterior cusp is the right coronary cusp and the posterior one the non coronary cusp. Left coronary cusp is not seen in this plane. The thickening and poor systolic separation of the aortic leaflets are evident.
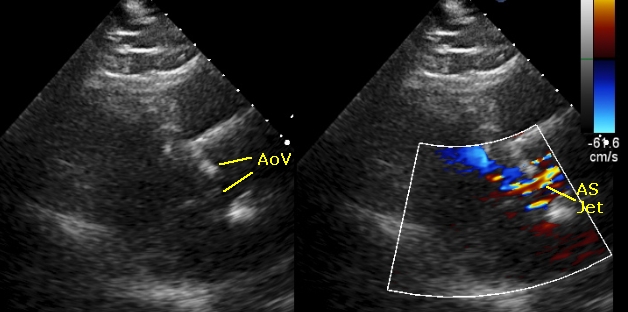
This split image is again from the parasternal long axis view with left panel showing 2 dimensional (2-D) image and the right panel showing colour flow mapping overlay in the colour Doppler sector. Being of high velocity and with significant turbulence, it is seen as a mosaic jet (AS jet). Width of the jet in the right panel fairly matches the leaflet separation seen in the left panel.
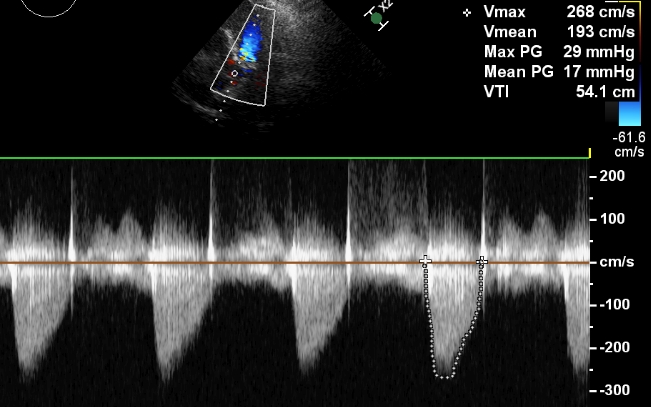
Aortic stenosis jet as seen on continuous wave (CW) Doppler with peak systolic velocity of 2.68 m/s and mean velocity of 1.93 m/s. These will translate to peak gradient of 29 mm Hg and mean gradient of 17 mm Hg, when calculated by the modified Bernoulli equation (P=4V2, where P is the pressure and V the observed velocity). Gradient may underestimate the severity of aortic stenosis in low flow situation. Low flow, low gradient severe aortic stenosis is a specific entity.
Related Posts

About The Author
Johnson Francis
Former Professor of Cardiology, Calicut Govt. Medical Kozhikode, Kerala, India. Editor-in-Chief, BMH Medical Journal