

Electrical axis can be calculated for the P wave, QRS complex or the T wave. It can even be calculated for the segments like ST segment, though it is seldom calculated. Most often only the average QRS axis is calculated and when electrical axis is mentioned, generally only mean QRS axis is meant. QRS axis can be altered in various disease states like intraventricular conduction defects, myocardial infarction, chamber hypertrophy and change in position of the heart.
Calculation of QRS axis
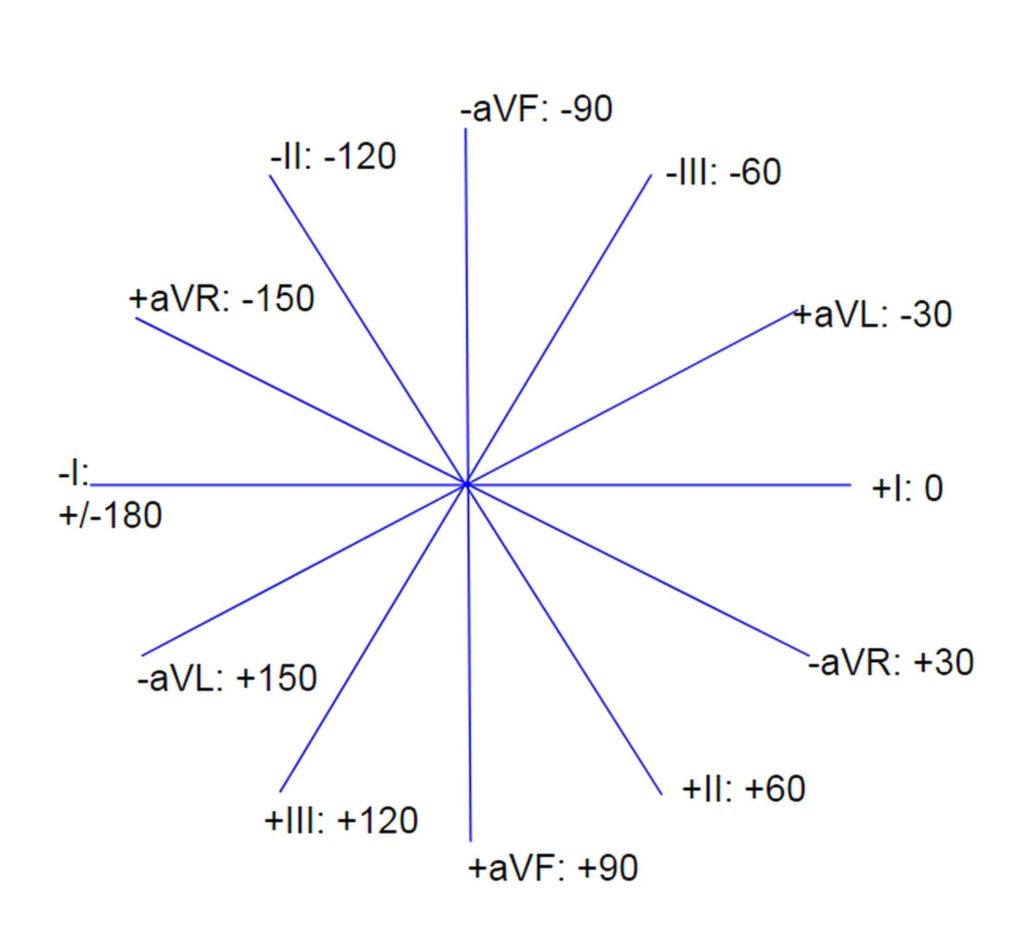
Theoretically it is possible to calculate the axis of each component of the QRS complex. But practically only mean QRS axis is needed for general purpose. For calculating mean QRS axis we have to know the orientation of each lead in the hexaxial reference system. In the hexaxial reference system, each lead is assigned an electrical axis depending on its orientation in the body. X-axis is formed by lead I which has a horizontal orientation with positivity towards left. Y-axis is formed by lead aVF. Positive pole of lead I (left arm) is designated 0 degrees in the hexaxial reference system. Positive pole of aVF (left leg) is designated +90 degrees. Positive pole of aVL is -30, aVR is -150, lead II +60 and lead III +120.
Simple and quick method of checking the QRS axis is to check whether the QRS is positive in leads I and aVF. If so, the axis is between 0 to +90 degrees. This will be taken as normal QRS axis. If aVF is negative and lead I positive, it is left axis deviation. On the other hand, if lead I is negative and aVF positive, it is right axis deviation. If both are negative, we call it North-West axis or indeterminate axis, which could be either extreme left axis or extreme right axis deviation.

More accurate method is to check which lead shows tallest QRS complex. The QRS axis will be in the direction of that lead. For example, if the QRS complex is tallest in lead II, QRS axis is +60 degrees. If QRS complex is equally tall in lead II and aVF, the QRS axis is midway between these two leads, +75 degrees.
The axis can be counter checked by which lead shows the lowest amplitude of QRS complexes. The QRS axis will be perpendicular to that lead. For example, if the lowest amplitude of QRS complexes are noted in lead III, QRS axis will be +30 degrees. If there is no lead with small QRS complexes, check the lead between which the QRS complexes change from predominantly positive to predominantly negative (transition zone). The QRS axis will be perpendicular to it. For example, if the transition is between aVL and lead I, the QRS axis is between lead II and aVF (+75 degrees).
If you go back to the ECG showing Katz-Wachtel in the previous page , QRS in lead I is negative, aVR equiphasic, and lead II positive. Hence the QRS axis is along lead III (+120 degrees), suggesting right axis deviation. This is further confirmed by the tallest QRS complexes in lead III
Calculation of P and T wave axes
Calculation of P and T wave axes are similar, but seldom done and more difficult because of the smaller amplitude of the waves. Difference between the QRS and T axes has been called the QRS-T angle, which is widened in ischemia.
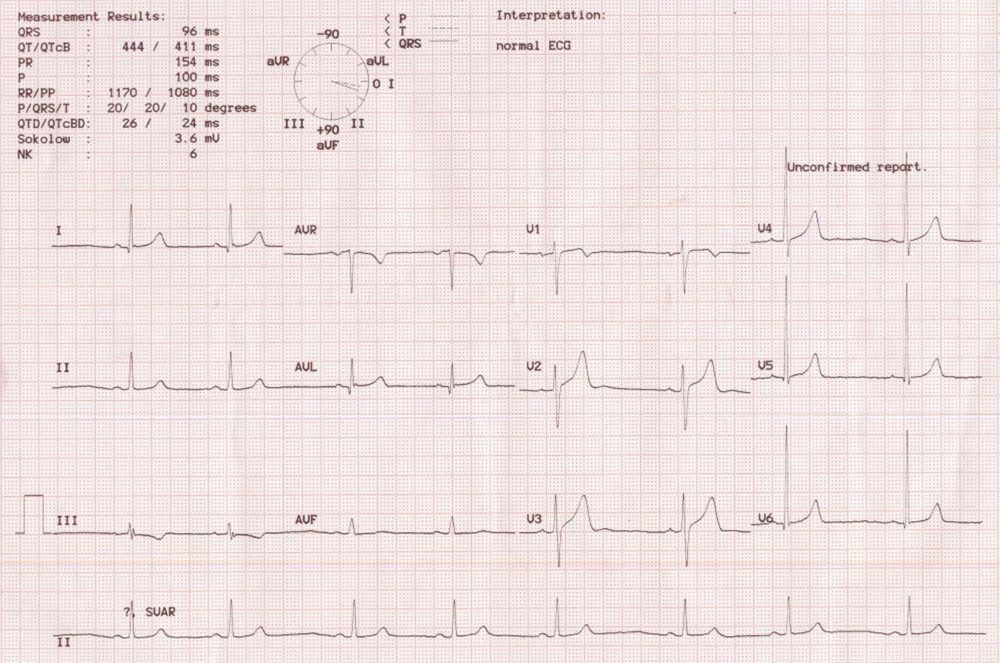

Computerized ECG recording with automatic display of calculated P, QRS and T waves axesComputerized ECG recording with automatic display of calculated P, QRS and T waves axes in a clock like diagram beside the measured values in the top panel. The display also shows the axes of the standard leads I, II, III and augmented leads aVR, aVL and aVF. The numerical values for the P, QRS and T wave axes are given in among the measured results in the left upper corner.