

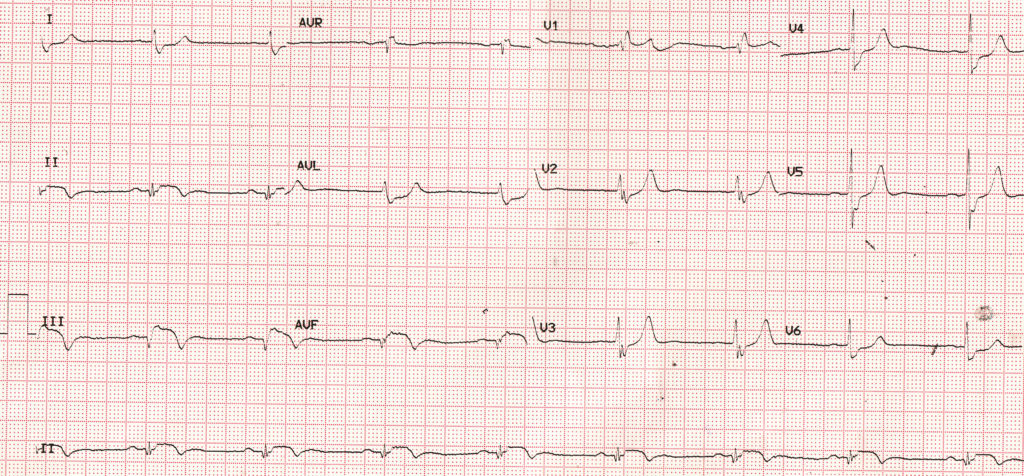
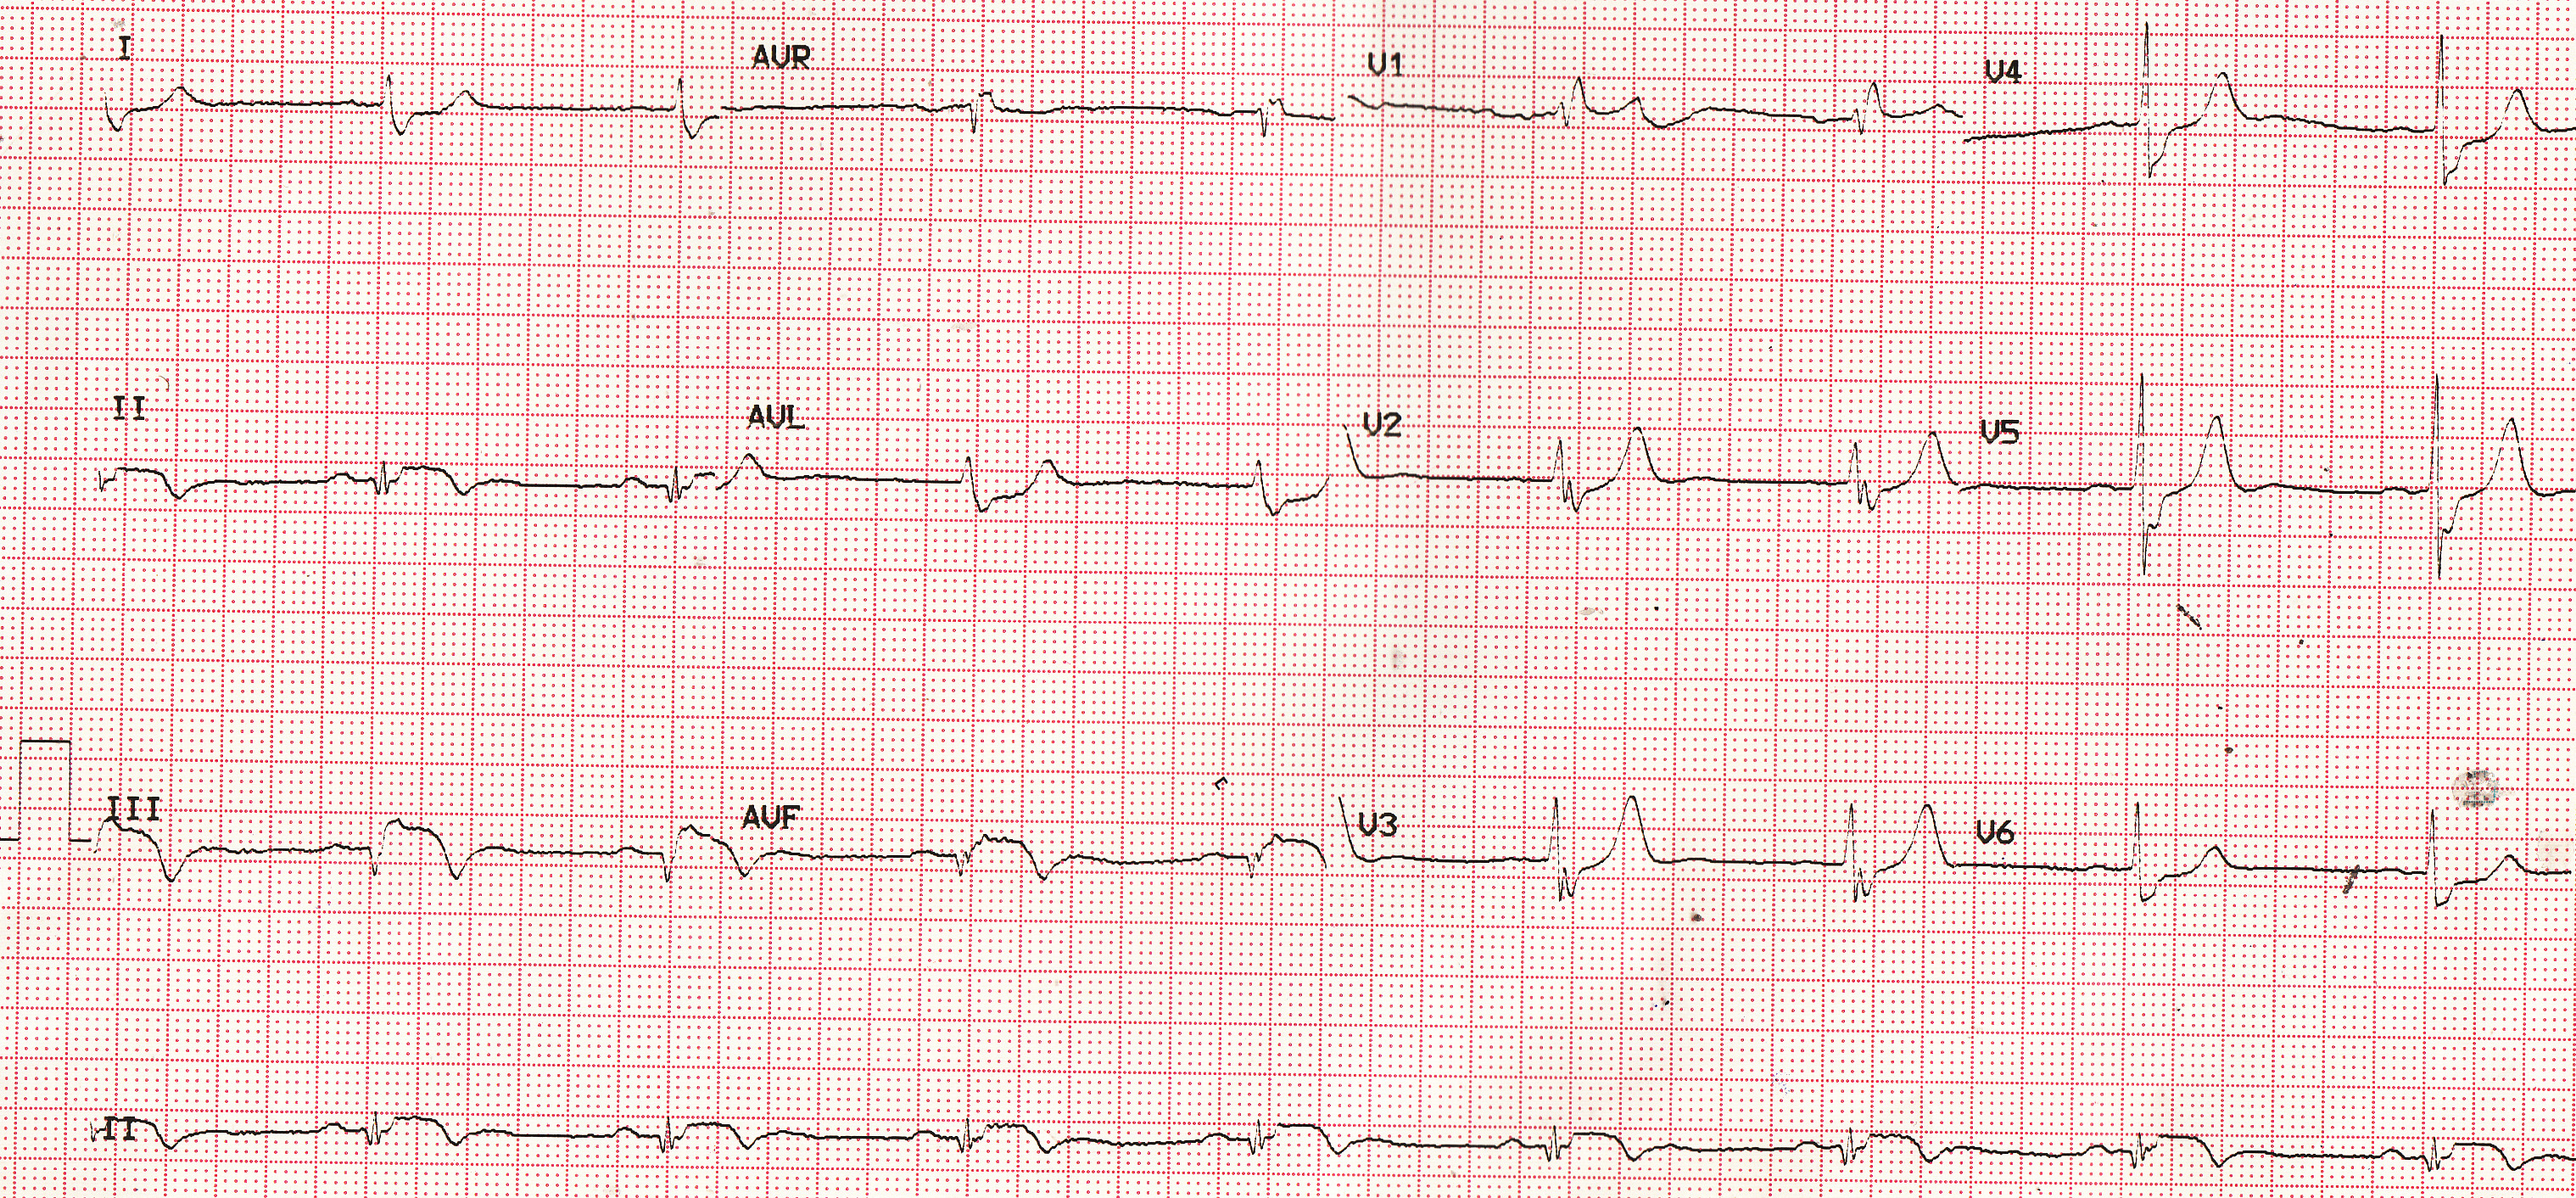
Evolved inferior wall myocardial infarction – ECG


ECG shows sinus bradycardia at 50/min, which is common in inferior wall infarction due to enhanced vagal activity, a usual association of inferior wall infarction. In fact inferior wall infarction is considered to be the commonest pathological cause of sinus bradycardia [1].
PR interval is 200 ms, which is the upper limit of normal. AV blocks are also quite common in inferior wall infarction as the right coronary occlusion which is often the cause of inferior wall infarction, also impairs the AV nodal blood supply.
Pathological Q waves are noted in inferior leads (II, III and aVF). Pathological Q waves have a width of at least 40 ms and an amplitude of at least 25% of the ensuing R wave [2]. Although these are the ‘classic criteria‘, other criteria known as TIMI (Thrombolysis In Myocardial Infarction) criteria and consensus 2000 and consensus 2007 criteria are also there [2]. TIMI criteria looks at R wave in addition to Q waves. According to TIMI criteria any Q wave of 30 ms or more duration in two contiguous leads, any Q or R wave of 10 ms or less width and 0.1 mV or less amplitude in lead V2 and R wave of 40 ms or more width in V1 are of similar significance.
Inferior leads (II, III and aVF) show the classical coved ST segment elevation along with T wave inversion. ST segment depression is noted in I, aVL and V6, which is often considered as reciprocal ST depression, though the jury is still out whether it represents ischemia at a distance.
ST segment elevation is more in lead III compared to lead II. This finding would suggest right coronary artery as the culprit vessel. If there is associated ST segment elevation in V1 indicating right ventricular infarction, it becomes a powerful marker of occlusion of right coronary artery in the proximal or mid segment [3]. In inferior wall infarction due to left circumflex coronary artery occlusion, ST elevation in lead II is higher than that in lead III.
In addition to these findings, an rsR’ pattern in V1 and slurred S waves in I, aVL and other lateral leads are seen. The QRS width is 120 ms. These findings indicate a right bundle branch block, which is not usual in inferior wall infarction and may represent an independent finding.
References
- Da Costa D, Brady WJ, Edhouse J. Bradycardias and atrioventricular conduction block. BMJ. 2002 Mar 2;324(7336):535-8.
- Delewi R, Ijff G, van de Hoef TP, Hirsch A, Robbers LF, Nijveldt R, van der Laan AM, van der Vleuten PA, Lucas C, Tijssen JG, van Rossum AC, Zijlstra F, Piek JJ. Pathological Q Waves in Myocardial Infarction in Patients Treated by Primary PCI. JACC Cardiovasc Imaging. 2013 Mar;6(3):324-31.
- Zimetbaum PJ, Krishnan S, Gold A, Carrozza JP 2nd, Josephson ME. Usefulness of ST-segment elevation in lead III exceeding that of lead II for identifying the location of the totally occluded coronary artery in inferior wall myocardial infarction. Am J Cardiol. 1998 Apr 1;81(7):918-9.