Right bundle branch block and left ventricular hypertrophy
Right bundle branch block and left ventricular hypertrophy
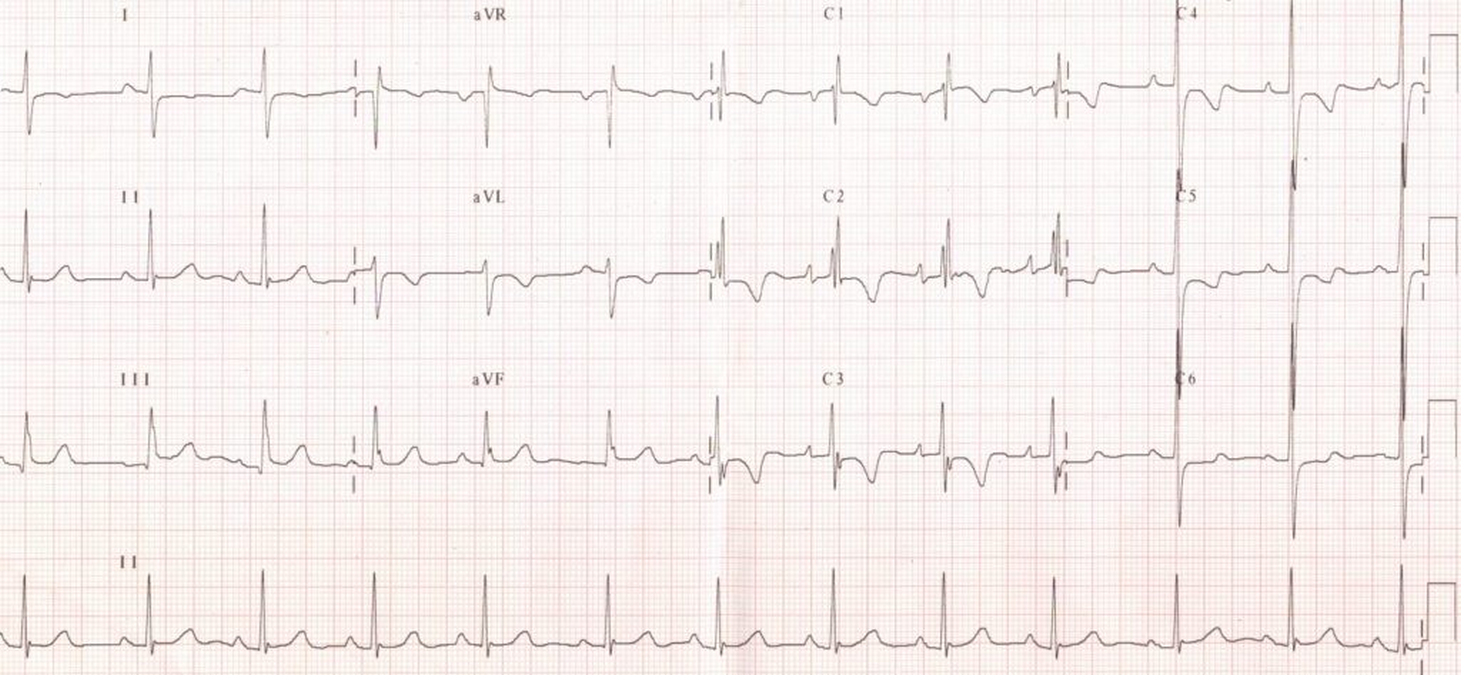
Tall R waves in lateral leads V5 and V6 with mild ST segment depression suggests left ventricular hypertrophy. In addition there is rSR’ pattern in V1 with T wave inversion in V1 – V3, suggestive of right bundle branch block. Negative P waves in V1 indicates left atrial enlargement. PR interval is at the upper limit of normal (200 ms).
Related Posts


About The Author
Johnson Francis
Former Professor of Cardiology, Calicut Govt. Medical Kozhikode, Kerala, India. Editor-in-Chief, BMH Medical Journal