Have a closer look at the waterfall display in FT-710
I have used only a Philips broadcast receiver for amateur radio operations in the remote past. On the transmitting side, initially I had a solid state VU2VWN QRP and later a 3 x 807 vacuum tube QRO, both homebrew. So it is only natural that I am quite happy with the waterfall display of FT-710! In Ham Radio transceivers, waterfall display is an almost real time display of activity on a particular region of the amateur band. It is seen as a chart which changes over time with frequency on the horizontal axis and time on the vertical axis. Signal strength is represented by the colour density of the display. In FT-710, waterfall starts from the top and comes down like a real waterfall, while I have seen it starting from the bottom and going up in some WebSDRs.
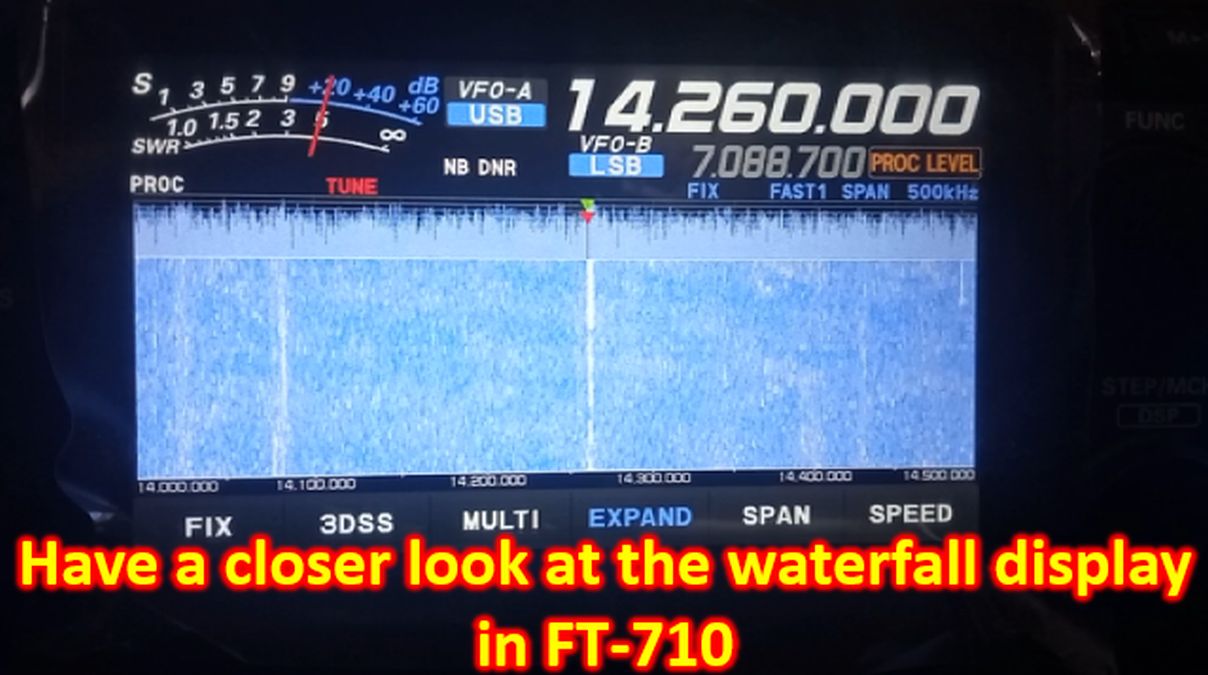
The waterfall display which I am showing here is not one during ideal band conditions, but one during usual operations on 20 m. The density of the waterfall display for the SSB Signal in the middle represents the signal strength, with weaker signals having lighter density and stronger signals thicker representation. Width of the signal would indicate the bandwidth occupied by it on the spectrum display. As you may have noted, this display is continuously monitoring 500 kHz of the 20 m band, though amateur radio operations are restricted to the first 350 kHz of the band. The background granular signals are the noise which quite common in an urban environment. You may note that I am using both a noise blanker and digital noise reduction to reduce the noise level.
The waterfall seen near 14.1 MHz is possibly digital signals as it corresponds to the FT-8 region at 14.074 MHz.
I often monitor the waterfall after muting the audio so that I can find out when SSB stations are coming on air. As I continue working on my laptop, the waterfall display on a DVI-D monitor nearby helps me to find out when a new station appears on the band. I can immediately move to the radio and use the mouse attached to the Type A USB port of the radio to click on the waterfall. Clicking on the waterfall brings the operating frequency of the radio close to the received signal. Fine tuning of frequency can be done using the large tuning knob so as to hear the SSB signal clearly.
Long press of the TUNE button on the radio tunes it for the lowest possible SWR using the built-in internal automatic antenna tuner of FT-710. If it is beyond the tunable range of the radio, HI-SWR indicator lights up in red colour and one has to check the antenna. HI-SWR indicator below the SWR cum signal strength meter will come up intermittently during tuning, which is normal operation of the automatic antenna tuner, along with a rattling noise of relays inside. During the tuning process, the radio automatically cuts down the power output to minimum, which you can see if you have an external SWR cum power meter attached in series with the feeder cable.
Please note that the meter display in this video clip is in Signal strength mode as it is in reception and not transmission. During transmission, it will display SWR live. There is an option to change it to display power output during transmission instead of SWR. But I usually use it in SWR mode as my homebrew antennas are far from perfect and I am quite concerned about the SWR. I am not concerned about maximum power output as FT-710 has a maximum output of only 100 W while my legal limit is 400 W!
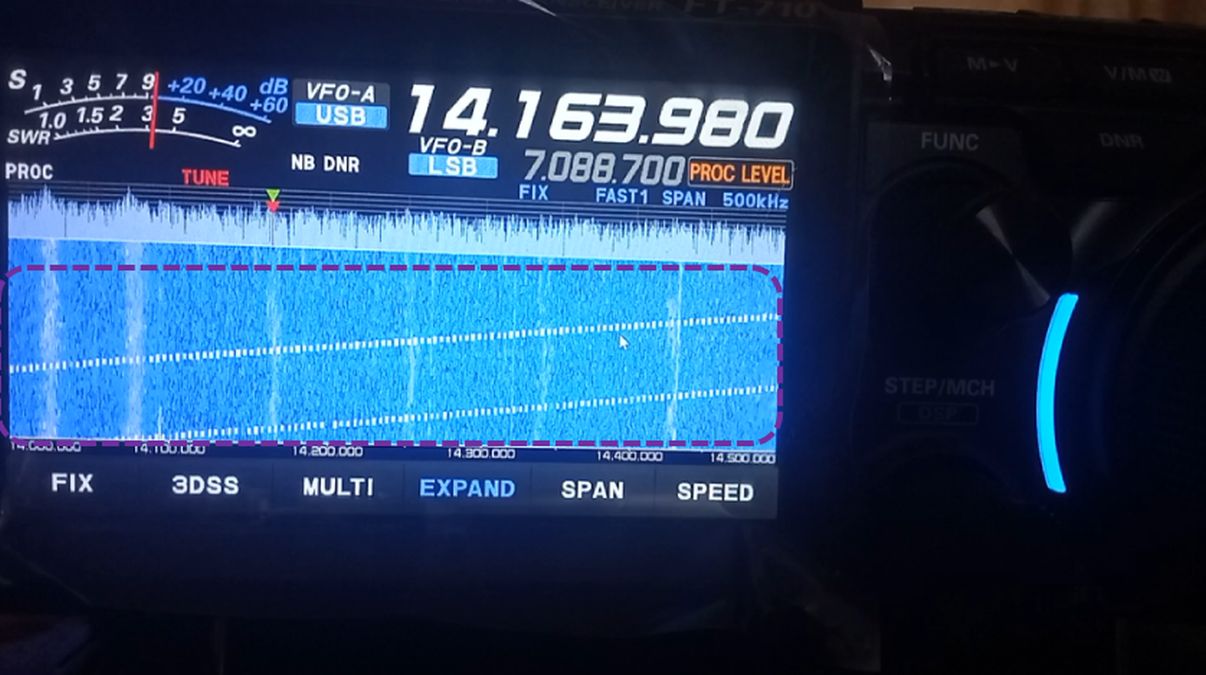
Now I will show you some examples of other signals which I have noted. Here you can see multple, almost equally spaced bands which do not look like the usual SSB signals. If I tune in to them, all what I hear is some noise on the radio. Though I have WSJT-X installed in a refurbished laptop, I have not used it yet to see if these are digital signals which I can decode with it. Somehow digital amateur radio is yet to charm me. As I did not have the opportunity to use SSB in my earlier stint on ham radio with homebrew setup, I wish to use it a bit more as long as the Solar Cyle 25 permits me, for DX operations. Though I have the Type A to Type B USB cable needed for CAT control in FT-710, being new to the radio, I am also a bit scared of needing a factory reset of the software in case I mess up with it!
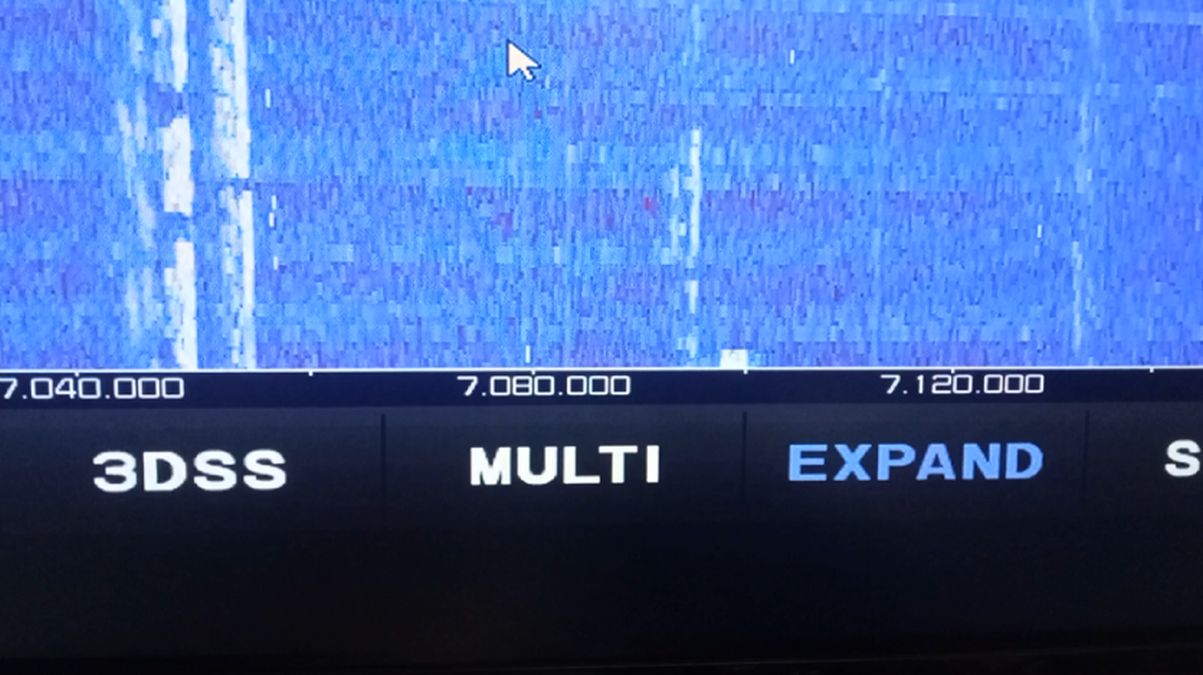
Another beautiful signal which I have noted is this thin line of tiny vertical strips running obliquely across the waterfall display. I have captured two such artifacts in this video clip. They come up intermittently without any specific time pattern. Usually they are seen only as one strip on a screen. Here as two of them came in a short time span, I could capture two in a single screen. I have noted this on 20 m and 40 m bands which I use often. Other bands I check only sparingly as I am yet to hear any intelligible SSB signals on those bands. I have half-wave dipole antennas for 20 m and 40 m, of which I try to use 40 m antenna also on 21 MHz or 15 m as it is third harmonic of 7 MHz 40 m amateur radio band. Of course, I do not know the origin of these beautiful signals on the waterfall display.
When the 40 m band is well open by about 9 am today, the waterfall display of the SSB signals come up much better and the background granular signals were minimum.
This is a better enlarged view seen on the external DVI-D monitor, focussed only on the waterfall display. You can see a couple of nice waterfalls of SSB signals above 7040 kHz and another around 7100 kHz. You can see the mouse pointer also on the screen.
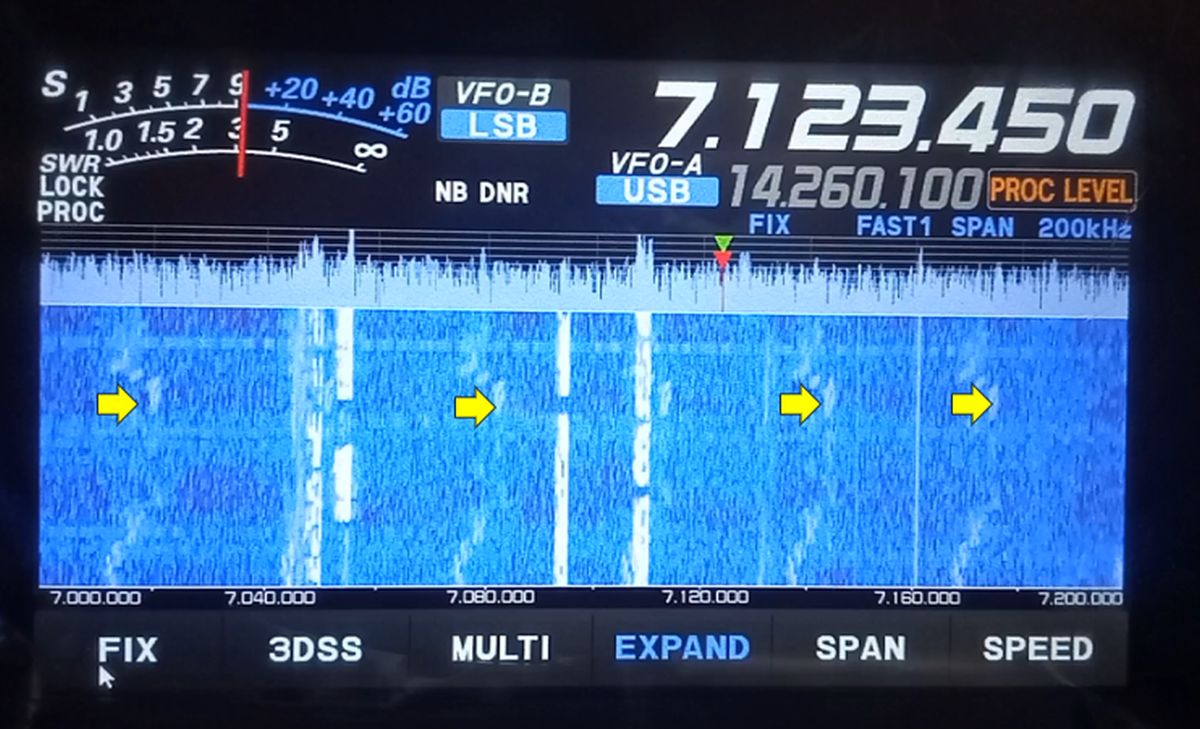
Here is another interesting observation on the waterfall, the ragged signals other than the nice waterfalls of SSB signals are noise due to an induction cooker working in another room, probably picked up through my power line. May be because I am new to it, I find observing the waterfall display on FT-710 quite interesting!
Note: This is a transcript for a YouTube video which you can find here.