What are the normal values for ECG measurements?
What are the normal values for ECG measurements?
Normal values for any measurement may vary with age, body size, gender and the population being assessed. Still some normal ranges are useful for routine use while interpreting an ECG. To start with is the simple measurement of heart rate from the ECG. Normal range of heart rate is taken as 60-100/min in an adult in the resting state. A new born infant can have a resting heart rate around 140/min. Resting heart rate comes down gradually as age advances, to reach the adult range.
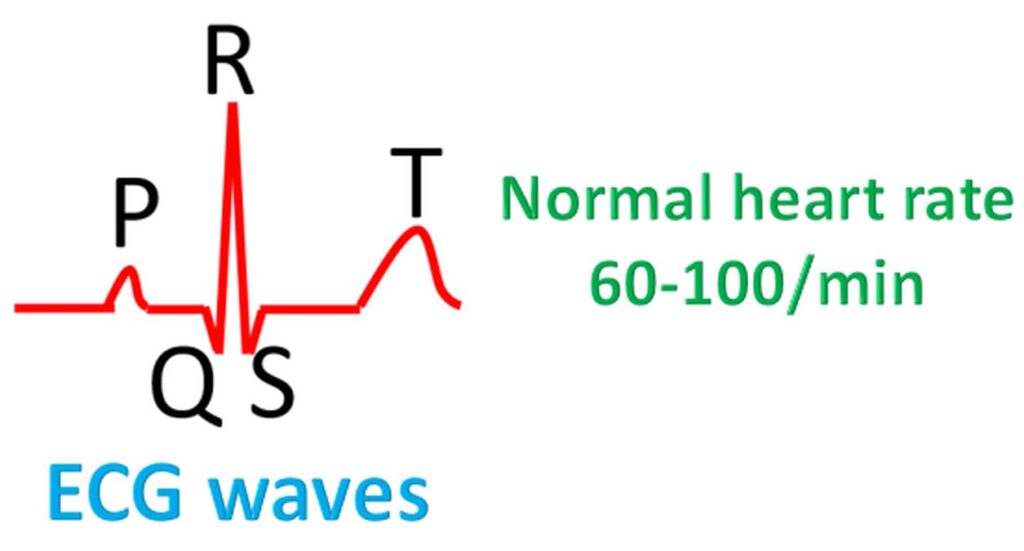
Heart rate goes up when you exercise, so that maximum predicted heart rate during exercise is 220-age of the person. The heart rate is measured in the ECG from the interval between two consecutive R waves. It is actually the rate of the lower chambers or the ventricles. If the rate of the P waves is different from that of the R waves, it has to be measured separately from the PP interval. Rate of P waves will give the rate of the upper chambers.
Both the width and height of the P are measured to assess enlargement of the upper chambers or the atria. P is due to the electrical activity of the upper chambers known as atria (depolarization). A normal P wave in an adult has 2.5 mm as the upper limit for both width and height, in a standard ECG recording at 25 mm/second paper speed. Width is increased in enlargement of the left atrium and height is increased in enlargement of the right atrium. If both are increased, both atria are enlarged.
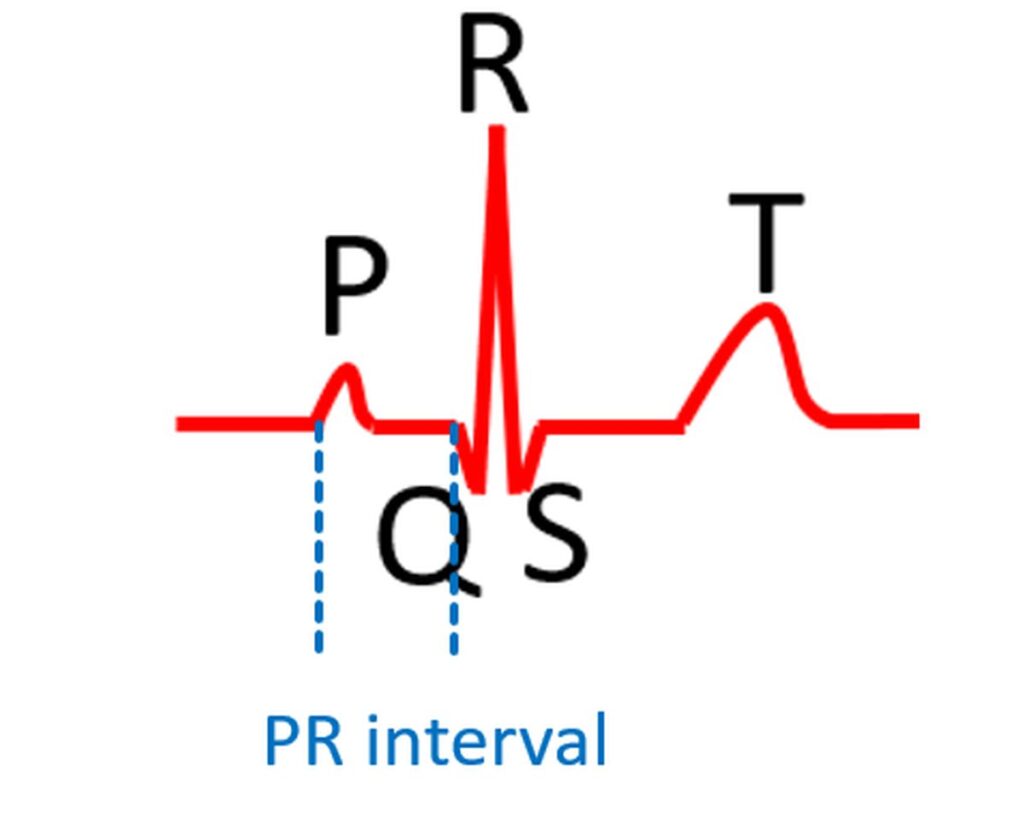
Next is the PR interval, measured from the onset of P wave to the onset of QRS complex. QRS complex is due to electrical activity of the ventricles (depolarization). PR interval represents the time taken for the electrical signals to conduct from upper most part of the atria to the beginning of the ventricles. Normal range of PR interval in an adult is 0.12 to 0.2 seconds. PR interval decreases as heart rate increases. So it is lower in children.
The width of the QRS complex is another important measurement. Normally it is less than 0.12 seconds in an adult. QRS complex which is 0.12 seconds (120 ms) or more is called a wide QRS and indicates slow or abnormal conduction in the lower chambers. It could be due to an electrical block in the conduction system of the ventricles or an abnormal sequence of electrical activation. QRS width is also lower in children due to the faster electrical conduction.
Another important interval is the QT interval, measured from the onset of the QRS complex to the end of T wave. T wave represents the repolarization of the ventricles, that is return of the electrical potentials to the baseline after the activation during depolarization. Usually the contraction of the ventricles is over by the end of T wave.
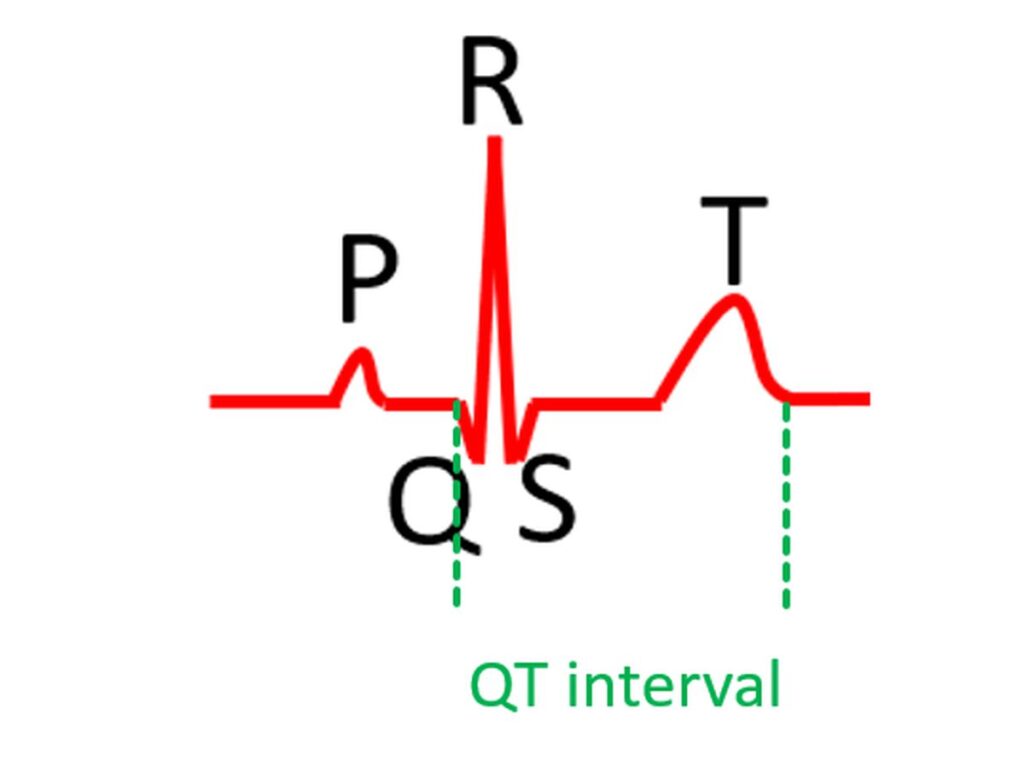
Normally, the QT interval is roughly less than half of the RR interval. Normal ranges are different for males and females. It can be taken as less than 0.4 seconds for males and less than 0.44 seconds for females. A normal range which is easy to remember is 0.34 to 0.43 seconds. Both abnormally prolonged QT interval and abnormally short QT interval can predispose to serious abnormalities of heart rhythm.
Many medications and abnormalities of blood electrolytes (potassium and magnesium) can affect the QT interval. QT interval can be abnormal in diseases which affect the conduction system of the heart. There are birth defects of the electrical system of the heart which are called congenital short QT syndromes and congenital long QT syndromes. In general, QT interval more than 0.5 seconds (500 ms) is considered risky in terms of development of heart rhythm abnormalities. Similar lower cut off is around 0.3 seconds (300 ms).
PR segment or the region between the P wave and the QRS is usually at the same level as the baseline. The region between the T wave and the next P wave is taken as the baseline. ST segment though supposed to be at the level of the baseline, is usually slightly upsloping and gradually merges with the beginning of the T wave.
Upward or downward shifts of the PR and ST segments are measured in mm on standard ECG recordings and mentioned in the report. Slight upsloping ST segment elevation is normal in the leads facing the front of the heart. A major ST segment elevation is an important sign of ST elevation myocardial infarction (STEMI), which is a major heart attack due to sudden blockage of a blood vessel supplying the heart muscle. This finding has to be supported by symptoms (mainly chest pain) and elevation of cardiac troponins in a blood test.
Related Posts


About The Author
Johnson Francis
Former Professor of Cardiology, Calicut Govt. Medical Kozhikode, Kerala, India. Editor-in-Chief, BMH Medical Journal