Electrocardiography (ECG) has grown a lot since the invention of the first practical electrocardiograph by Willem Einthoven in 1903. The initial devices were very large and one had to immerse three limbs in jars filled with salt water in order to get the ECG recorded. Now the devices have been miniaturised with the help of new generation electronic circuits so that even small hand held devices can record ECG. ECG monitoring has become commonplace in all emergency departments, intensive care units and operation theatres.
ECG records the electrical activity of the heart. The electrical activity of the heart normally originates in the sinoatrial (SA) node situated in the upper right part of the right atrium and gets conducted down sequentially to reach the ventricles. Conduction from the SA node to the next relay station known as atrioventricular node (AV) node in the lower part of the right atrium is through internodal pathways which are specialised conducting tissue in the right atrium. One of the internodal pathways has a branch to the left atrium through which conduction occurs simultaneously to the left atrium. In the AV node there is a short delay for the impulse transmission, after which it reaches the bundle of His for onward conduction to the ventricles. Bundle of His has two divisions – right and left bundle branches, meant for the two ventricles. Left bundle branch has two subdivisions – anterior and posterior, and sometimes a third septal branch. These subdivisions are known as fascicles. From the fascicles, conduction reaches the ventricular muscles through a branching system of Purkinje fibres.
ECG is commonly recorded using electrodes attached to various parts of the body surface. If recordings are taken with electrodes kept within the heart, it is known as intracardiac electrogram, which is done during invasive electrophysiology study inside the electrophysiology laboratory. Conventionally ECG uses 4 limb electrodes on each of the four limbs, of which the electrode on the right leg is considered electrically neutral while the other three are active electrodes. In addition to this 6 electrodes are placed on specifically designated parts of the chest to get chest lead recordings. Though there are only 10 electrodes which are used for recording a usual ECG, various lead combinations can be recorded with these electrodes so that most common recording is a 12 lead ECG. Number of leads may be increased using additional electrodes in specific situations.
Waves, segments and intervals in an ECG
Waves noted in a normal ECG are called P wave, QRS complex, T wave and sometimes a U wave. Other waves which can be rarely seen are delta waves and epsilon waves.
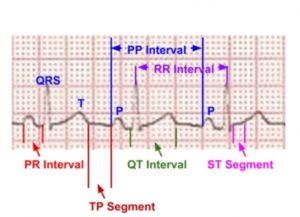
P wave represents the depolarization of the atria while QRS complex represents the depolarisation of the ventricles. T wave is due to the repolarisation of the ventricles. PR segment is between the P wave and the QRS complex while the ST segment is between the QRS complex and the T wave. TP segment is between the T wave and the next P wave. It is considered as the true baseline in the ECG. Intervals contain one or more waves and a segment. PR interval contains the P wave and the PR segment and is measured from the onset of the P wave to the onset of the QRS complex. QT interval contains the QRS complex, ST segment and the T wave. It is measured from the onset of the QRS complex to the end of T wave. PP interval is measured from the onset of one P wave to the onset of next P wave. RR interval is measured from the onset of one QRS complex to the onset of next QRS complex or as the interval between the peaks of two consecutive R waves for simplicity. Delta waves occur at the onset of QRS complex and Epsilon waves are seen at the end of the QRS complex, in certain pathological conditions. A prominent U wave after the T wave can be seen in hypokalemia.
Components of QRS complex
An initial negative deflection which is part of the QRS complex is called Q wave. An initial positive deflection is named R wave. A second negative deflection or a negative deflection following an R wave is called S wave. A second positive deflection will be termed R’ wave. If there is a negative deflection after the R’ it is called S’. Waves less than 5 mm amplitude may be designated by small letters so that an rSr’ would mean a small r followed by normal sized S and a small r’ wave. rSR’ would indicate that the terminal R’ wave is of good amplitude.
A bit more on U waves
U wave on ECG occurs after the T wave and is usually seen in the mid precordial leads. In hypokalemia, T wave becomes flattened and U wave becomes prominent (or apparently so because of near absence of T waves). Important conditions associated with U waves are systemic hypertension, aortic and mitral regurgitation and coronary artery disease [1].
Theories about genesis of U waves
One theory about the genesis of U wave is that it is due to repolarization of the Purkinje fibres. Another possibility is that it is due to after potentials caused by mechanical forces in the ventricular wall. A third hypothesis suggests that it is due to prolonged repolarization of the mid myocardial M cells [2]. Yet another hypothesis is the delayed repolarization of papillary muscles [3]. None of these theories have been widely accepted.
Importance of negative U wave
An inverted U wave usually has the same significance as an inverted T wave. A negative U wave is considered to be highly specific for heart disease and is associated with other abnormal findings on ECG in 90% of cases [1]. A discordant U wave inversion (with upright T wave inversion) is also thought to represent myocardial ischemia. An interesting case of U wave due to compression of the right ventricle by a reconstructed stomach tube after surgery for esophageal cancer has been reported [4]. Persistent giant U wave inversion was noted in a case after anoxic brain injury [5].
Exercise induced U wave inversion
Exercise induced U wave inversion in anterior leads has been associated with stenosis of proximal left anterior descending coronary artery in multiple case reports [6,7].
U wave alternans
U wave alternans along with pulsus alternans has been described in left ventricular failure [8].
References
- Kishida H, Cole JS, Surawicz B. Negative U wave: a highly specific but poorly understood sign of heart disease. Am J Cardiol. 1982 Jun;49(8):2030-6.
- Ritsema van Eck HJ1, Kors JA, van Herpen G. The elusive U wave: a simple explanation of its genesis. J Electrocardiol. 2003;36 Suppl:133-7.
- Pérez Riera AR, Ferreira C, Filho CF, Ferreira M, Meneghini A, Uchida AH, Schapachnik E, Dubner S, Zhang L. The enigmatic sixth wave of the electrocardiogram: the U wave. Cardiol J. 2008;15(5):408-21.
- Yamagata K, Uno K, Mori K, Seto Y. Unusual U wave induced by reconstructed retrosternal esophagus. Clin Case Rep. 2015 Nov;3(11):949-951.
- Peters MN, Katz MJ, Howell LA, Moscona JC, Turnage TA, Delafontaine P. Persistent giant U wave inversion with anoxic brain injury. Proc (Bayl Univ Med Cent). 2013 Apr;26(2):177-8.
- Costantini M, Capone S, Tondo A, Oreto G. Is exercise-induced U-wave inversion predictive of proximal left anterior descending coronary artery disease? J Electrocardiol. 2008 Mar-Apr;41(2):99-101.
- Raveendran S, Hadfield R, Petkar S, Malik N. Significance of exercise induced U wave inversion as a marker for coronary artery disease. BMJ Case Rep. 2012 Feb 10;2012. pii: bcr0420114132.