Recording a Good ECG
Recording a good ECG is the first step in getting a good diagnosis using it. If the recording is technically incorrect, interpretation can go wrong. First and foremost is to place the electrodes correctly in the recommended positions. Some knowledge of human surface anatomy is required for accurate placement of electrodes. Skin-electrode contact should be good for transferring the microvolt range of potentials accurately from the body to the ECG machine. If the skin is too hairy, it may be worthwhile shaving the area before applying the electrode gel.
Limb electrodes are usually attached using clips to the distal region of each limb. Chest leads are attached using suction cups attached to compressible rubber spheres. In case there is difficulty in attaching chest leads by suction, one can remove the suction cups and stick the bare electrodes to the designated parts of the chest using adhesive takes. This method may have to be resorted to in small children and infants mostly because there may not be enough space on the chest to keep all the 6 electrodes. Sometimes this technique has to be used for limb electrodes when the distal part of the limb is covered by surgical dressing. In that case, the electrode is attached just proximal to the dressing using adhesive tapes.
Avoiding electrical interference
Avoiding interferences from nearby electrically operated devices is often a challenge while recording ECG in the intensive care setting. ECG monitoring leads attached to the patient may have to be temporarily removed to prevent artefacts due to alternating current (AC) picked up from these leads. Power cords of electrically operated beds, pneumatic compression devices, infusion pumps and other electrically operated devices in close vicinity may also have to be removed from power sockets to reduce electromagnetic interference from AC line. AC interference is seen as a symmetrical sine wave pattern in the baseline, at the frequency of the line voltage in the vicinity. It can be either 50 Hz or 60 Hz, depending on the line voltage frequency in the locality. In most modern ECG machines, notch filters are used to suppress AC interference. In spite of this, AC interference may still appear in the recorded tracings if the interference is strong.
Avoiding artefacts due to muscle activity
Equally important is avoiding interference from muscle activity – electromyogram or EMG artefacts. If patient is restless, a good explanation of the procedure and pacification often helps. Warming the patient with a warmer or a blanket may be needed if shivering due to the cold atmosphere is noted. Sometimes we may have to switch off the air conditioner temporarily to make the person comfortable, especially in the intensive care unit or post-operative ward. Tremor in diseases like Parkinson’s disease can also be troublesome. Sometimes coarse tremors produce artefacts resembling ventricular tachycardia. Fine tremor artefacts can even resemble ventricular fibrillation. This is more likely to be confusing while monitoring ECG in the intensive care setting, especially if the lead being monitored has low amplitude of QRS complexes. Artefacts can be severe enough to mask the low voltage QRS complexes and lead to wrong interpretation.
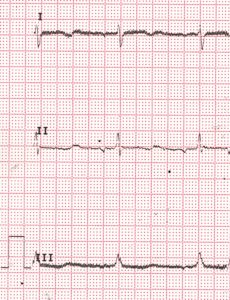
50 Hz alternating current (AC) line voltage interference in the baseline: Symmetrical sine wave pattern interference is seen in the baseline, best noted in leads I and III in this case.
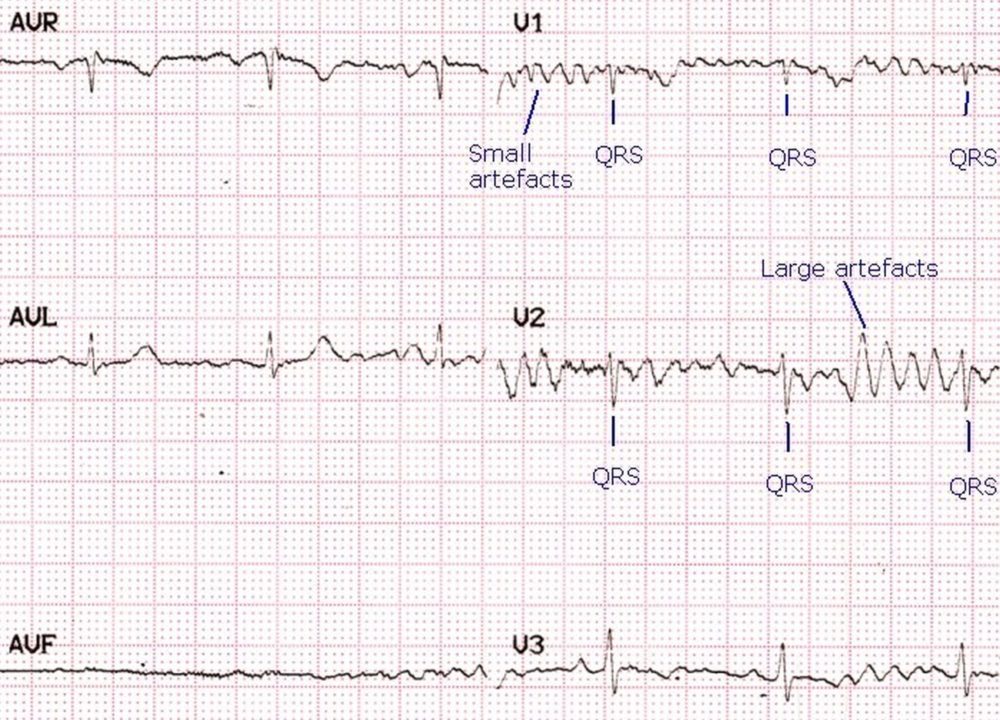
Artefacts resembling ventricular fibrillation, almost masking QRS complexes: Artefacts in an ECG (electrocardiogram) can mimic various pathological conditions. In V1, multiple small artefacts almost totally obscure the small QRS complexes so that at one look it mimics ventricular fibrillation (VF). Close scrutiny with comparison with other leads enables recognition of QRS complexes within the artefacts by their timing with other QRS complexes simultaneously recorded in other leads (V3), where the amplitude of the artefacts are much lower than that of the QRS complexes. In V2, certain artefacts resemble a wide QRS tachycardia. The fact that it has not affected the regular QRS rhythm in other simultaneously recorded leads indicate that these are artefacts and not a run of polymorphic ventricular tachycardia. This also illustrates the advantage of monitoring multiple leads simultaneously while observing for arrhythmias. In this case a single lead V1 monitoring could lead to initiation of CPR (cardiopulmonary resuscitation) if one is not vigilant enough to follow the regular pre-CPR sequence for identification of cardiac arrest before initiating chest compressions. Similarly monitoring of V2 could lead to an ‘inappropriate shock’ external DC (direct current) shock being delivered.
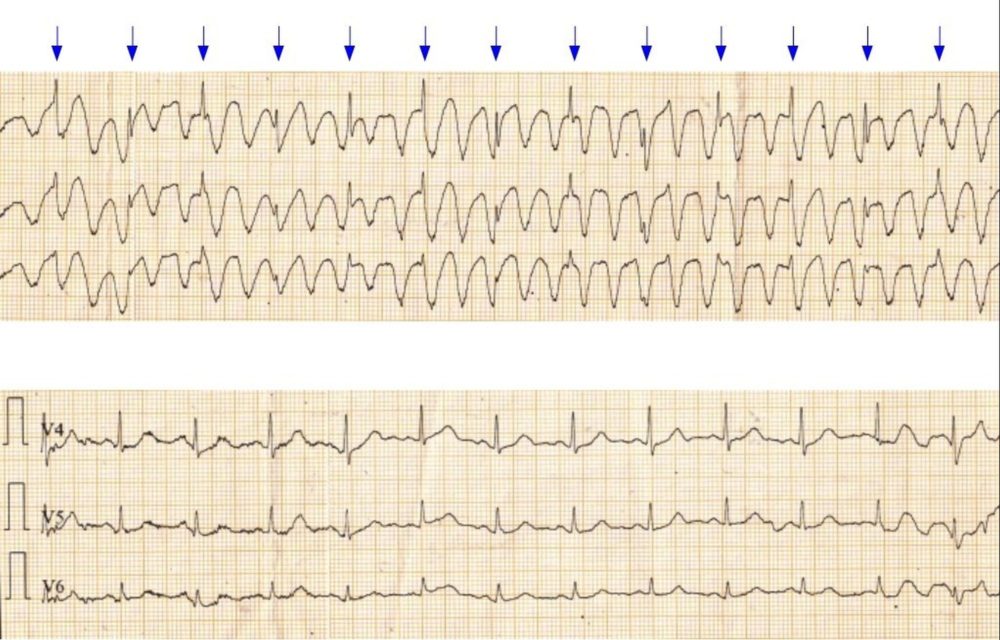
Tremor artefact resembling ventricular tachycardia: ECG shows artefacts due to tremor resembling a ventricular tachycardia (VT). The upper panel shows the artefacts resembling a wide QRS tachycardia and the lower panel shows the ECG with same leads when the tremor was not severe. The spikes of the QRS complexes (blue arrows) can be seen at regular intervals even when the tremor artefacts are strong. Similar artefacts can sometimes be seen on the cardiac monitor during chest physiotherapy due the movement artefacts picked up by the chest electrodes. Occasionally unilateral tremor may produce artefacts only in leads involving that particular limb, while it may be absent in other ECG leads. Artefacts resembling wide QRS tachycardia can lead on to ‘inappropriate shocks’ in an ICU setting! This can be avoided by physically checking the pulse every time an ‘arrhythmia’ is detected and therapy planned.
In small children sedation may often be required before recording ECG as they are sometimes anxious about the leads being connected. Alternate method is recording an ECG during natural sleep.
Filter settings
ECG machines have a high pass filter which passes frequencies above it and a low pass filter which passes frequencies below it to the ECG amplifier. Low pass filter is meant for filtering out high frequency interferences like muscle artefacts and high pass filter for respiratory fluctuation in baseline. In addition there is a notch filter for line voltage, usually set at 50 or 60 Hz depending on the frequency of the alternating current in the locality. When the notch filter is disabled, alternating current interference will become prominent and baseline becomes very wide with 50 Hz sine wave interference as shown above.
Usually for reducing artefacts, default setting of filters is 0.08 – 40 Hz. When a permanent pacemaker has been implanted, too low setting of low pass filter can make the pacing artefacts almost invisible. Low pass filter has to be kept above 100 Hz (typically 150 Hz) to make the pacing spikes evident, as shown below. In an emergency setting, when it is not known that the patient has a pacemaker in situ, ECG taken with default low pass filter setting of 40 Hz is likely to be mistaken as a left bundle branch block as right ventricular pacing gives a left bundle branch block pattern on the ECG.
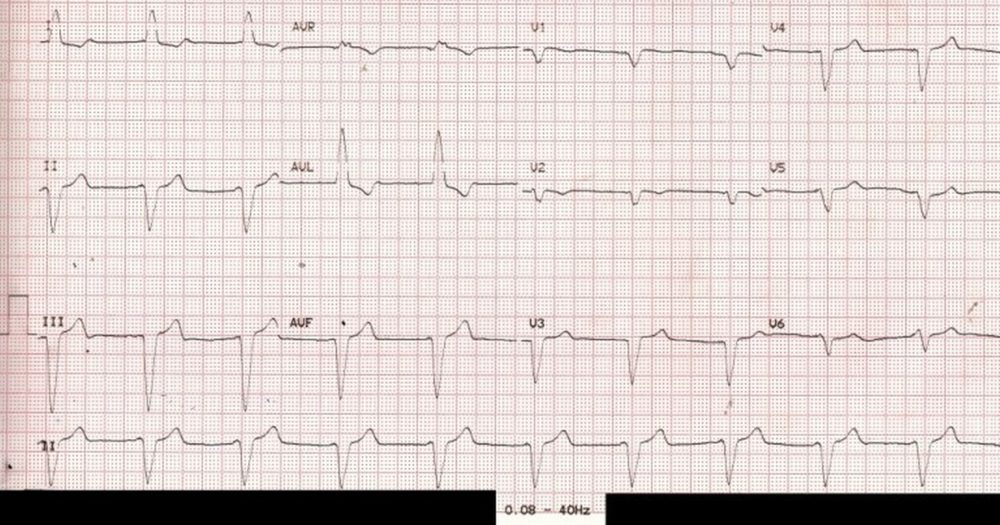
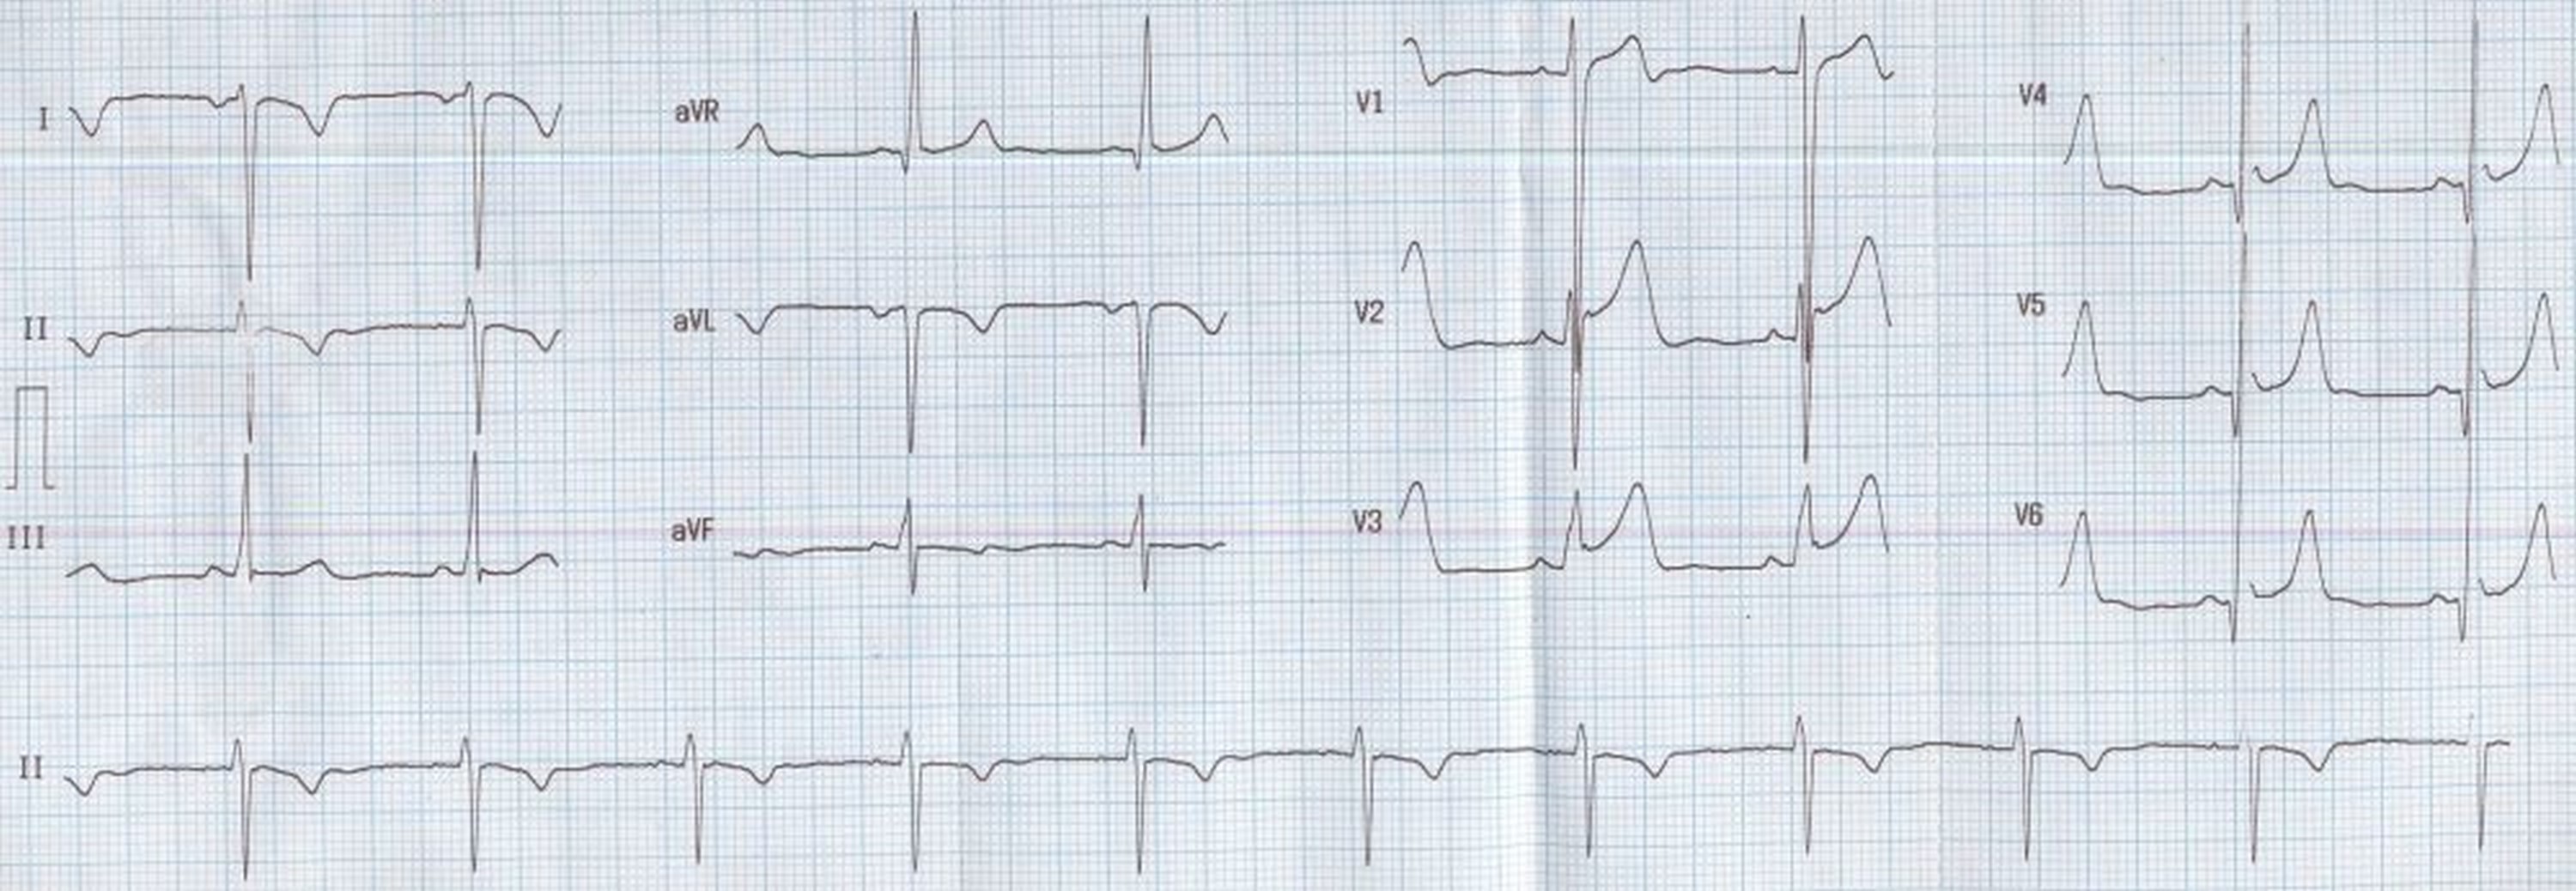
ECG with filter range 0.08 – 40 Hz – pacemaker spikes not visible: In modern day digital ECGs, filter settings can beautify the tracings, but vital information can be filtered out, as in this case, which is quite common. In the illustration 0.08 Hz is the high pass filter, meaning that the ECG amplifier passes all frequencies above that limit. 40 Hz is the low pass filter, indicating that all frequencies below that can pass through. Pacemaker spike (pacemaker artefact, pacemaker stimulus) being a high frequency signal, is effectively filtered out by the above filter setting. Hence the above ECG is likely to be diagnosed as left bundle branch block (LBBB) at one look, though we are missing the P waves before each QRS complex which would be expected in a simple LBBB with sinus rhythm.
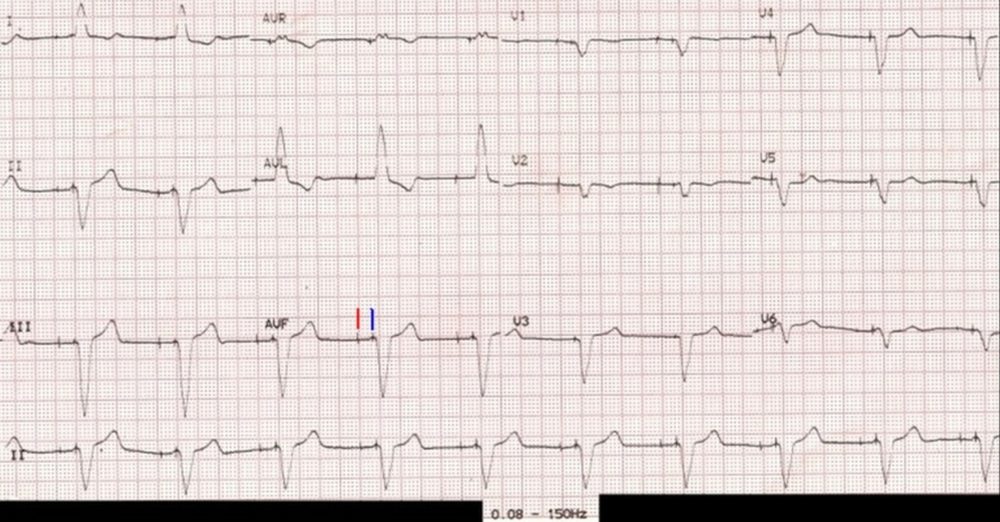
ECG with filter range 0.08 – 150 Hz – pacemaker spikes visible: The pacemaker spiked are easily seen when the same ECG is repeated with a change in the low pass filter to 150 Hz. In fact both atrial and ventricular pacing spikes (markers in aVF) are seen before each QRS complex, with an interval in between. Hence this person has a functioning dual chamber pacemaker in situ. The paced P waves are of low amplitude and hardly visible (or it could be lack of atrial response to atrial pacing – atrial capture failure).
The high pass filter is meant to filter out baseline fluctuations due to respiration and other low frequency signals, while low pass filter avoids muscle potential interference (EMG artefact). In addition, most ECG machines have a notch filter at 50 Hz to specifically filter out line voltage interference.
Arm lead inversion / technical dextrocardia
Arm lead inversion (right arm lead placed on left arm and vice versa) can be recognized by inverted P waves, negative QRS and T waves in lead I. The same pattern can be seen in true dextrocardia as well. But in true dextrocardia, the chest electrodes will not show the usual progression of R waves, instead the QRS amplitude will progressively decrease from V1 to V6 as the heart is on the opposite side. Simple option is to get a repeat ECG for verification, if possible under direct supervision. Arm lead inversion or technical dextrocardia is one of the commonest errors in ECG recording.
Arm lead inversion / technical dextrocardia: This ECG also shows narrow Q waves and prominent T waves in lateral leads with mild concave upwards ST segment elevation. The S waves in lead V1 is deep and the R waves in V6 are tall, possibly an evidence of left ventricular hypertrophy by voltage criteria.