Chamber Enlargements
Atrial enlargement
Normal P wave has an amplitude of 2.5 mm and width of 2.5 mm on the ECG. An increase in the amplitude is an indication of right atrial enlargement and increase in width an indication or left atrial enlargement. When both atrial are enlarged, both width and amplitude are increased. Some authors use the term overload or abnormality instead of enlargement, with the same meaning. Several specific patterns for atrial enlargement have been described. M shaped wide P of left atrial enlargement is usually best seen in lead II and is known as P mitrale. Tall peaked P wave of right atrial enlargement in lead II is known as P pulmonale.
A prominent rounded negative P wave in lead V1 also indicates left atrial enlargement. Right atrial enlargement manifests as peaked positive P waves in V1. When both atria are enlarged, there is a combination of a peaked positive deflection followed a prominent rounded negative deflection in V1. A sharp negative deflection in V1 sometimes seen in atrial septal defect with right atrial enlargement is often called pseudo left atrial enlargement pattern.
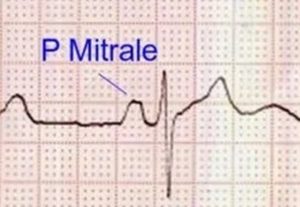
P mitrale in left atrial enlargement
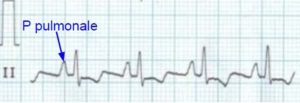
P pulmonale: Tall peaked P waves in lead II
P Tricuspidale
Notched P wave in lead II with the first peak taller than the second, indicates biatrial enlargement and has been called ‘P tricuspidale’ [1,2]. The original description of ‘P tricuspidale was by Zuckermannn R et al in 1952 [2]. The pattern is a mirror image of the ‘P mitrale’ in which the second peak is taller. P tricuspidale was noted by Gamboa R and associates in 81 percent of their thirty seven patients with tricuspid atresia, while it was seen in only two of their twenty patients with pulmonary atresia [1]. In P tricuspidale, the taller initial peak is the right atrial component and the second wider peak is the left atrial component. That is how it indicates biatrial enlargement.
It may be noted that in pure left atrial enlargement the P wave in lead II is widened, usually with a notch separating the right and left atrial components, but the amplitude of the P wave is within the normal range.
References
- Gamboa R, Gersony WM, Nadas AS. The electrocardiogram in tricuspid atresia and pulmonary atresia with intact ventricular septum. Circulation. 1966 Jul;34(1):24-37.
- Chugh SN. Textbook of Clinical Electrocardiography. Jaypee Brothers Publishers. Page 78.
- Zuckermannn R, Cisneros F, Novelo S. El electrocardiograma en 21 topos diferentes de cardiopatias congenitas. Arch Inst Cardiol Mex 22: 550, 1952.
Right ventricular hypertrophy
Right ventricular hypertrophy can manifest as tall R waves in V1 or deep S waves in lateral leads or both together. R/S ratio in V1 more than 1 is also indicative of right ventricular hypertrophy. Right axis deviation of QRS axis is another feature of right ventricular hypertrophy. qR pattern in V1 is suggestive of severe right ventricular hypertrophy, especially if associated with ST segment depression and T wave inversion (strain pattern). While these are features of right ventricular pressure overload, an incomplete right bundle branch block pattern is taken as evidence of right ventricular volume overload, as is often seen in atrial septal defect with large left to right shunt.
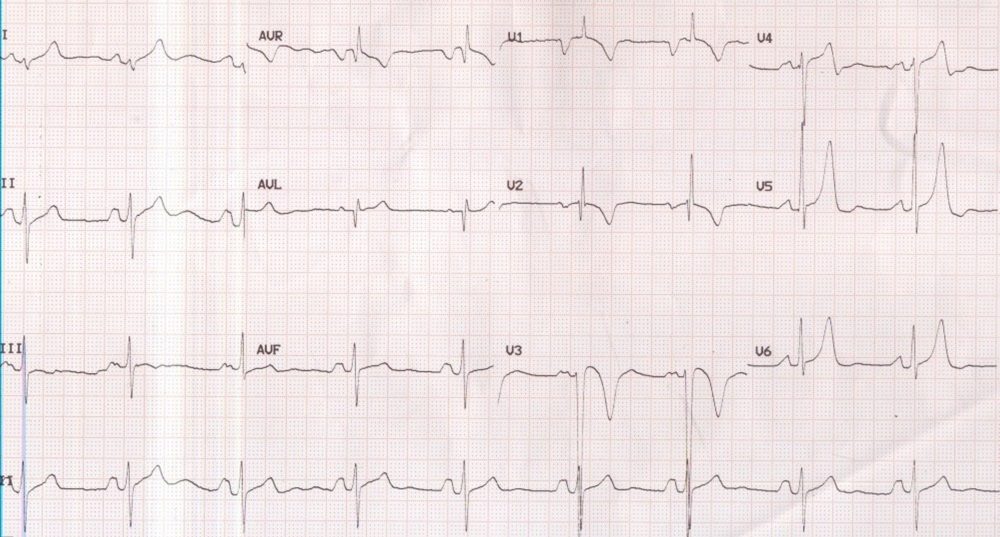
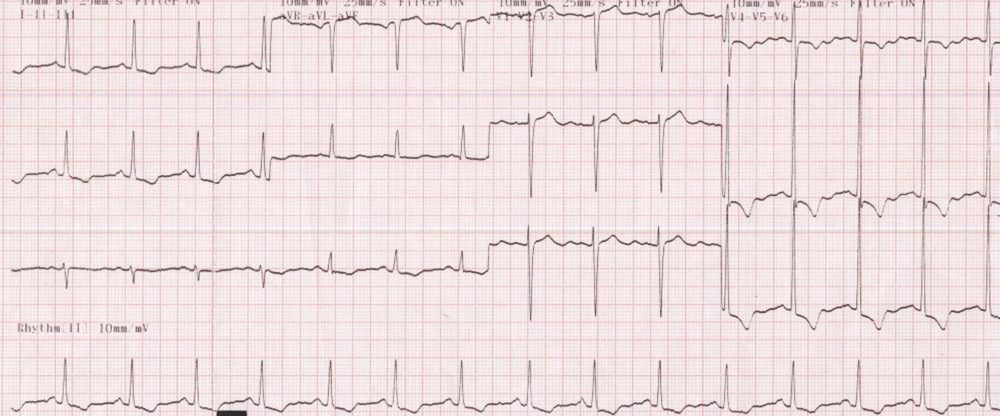
P mitrale and right ventricular hypertrophy
P mitrale and right ventricular hypertrophy: P mitrale of left atrial enlargement is manifest as broad notched (M shaped) p wave in lead II, classically seen in mitral stenosis. The broad negative P wave in V1 is also indicative of left atrial overload. qR pattern in V1 with T wave inversions in anterior leads is suggestive of right ventricular hypertrophy. The axis appears to be in the north-west or indeterminate region, which could be a manifestation of extreme right axis deviation due to right ventricular hypertrophy as a consequence of pulmonary hypertension in mitral stenosis. T waves in V5 and V6 are unusually tall. Lead II rhythm strip at the bottom of the tracing documents a normal sinus rhythm, which can anytime degenerate into atrial fibrillation in this case with gross left atrial overload. Such degeneration into atrial fibrillation can cause rapid initial deterioration in clinical status, sometimes presenting as pulmonary edema. Patients with severe pulmonary hypertension due to obliteration of pulmonary vascular bed can be sometimes be protected from pulmonary edema as the right ventricular output is restricted to certain extend, which could also be due to right ventricular dysfunction and associated tricuspid regurgitation.
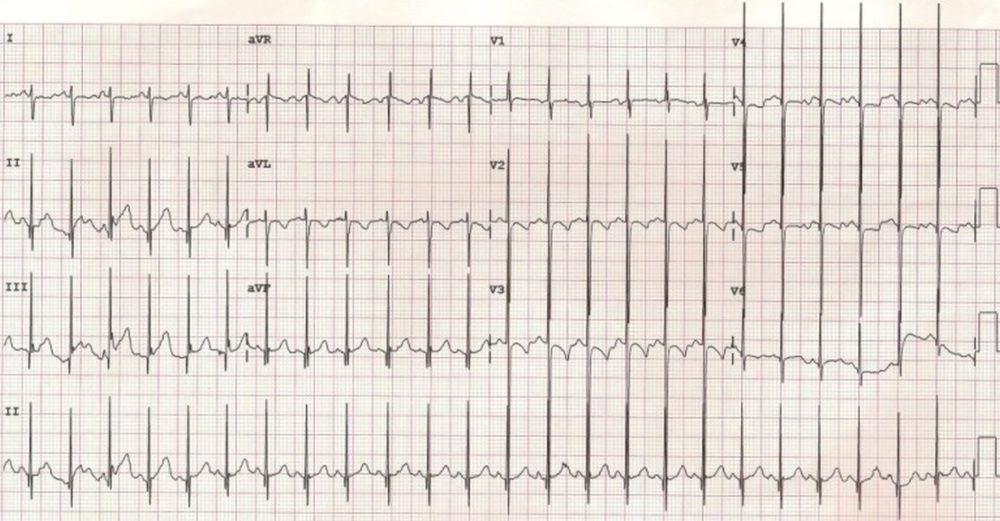
Right ventricular hypertrophy with tall R in V1, deep S in V6 and right axis deviation. There is associated P pulmonale in lead II, indicating right atrial enlargement secondary to right ventricular hypertrophy. Sharp positive P wave in V1 also reflect right atrial enlargement.
Left ventricular hypertrophy
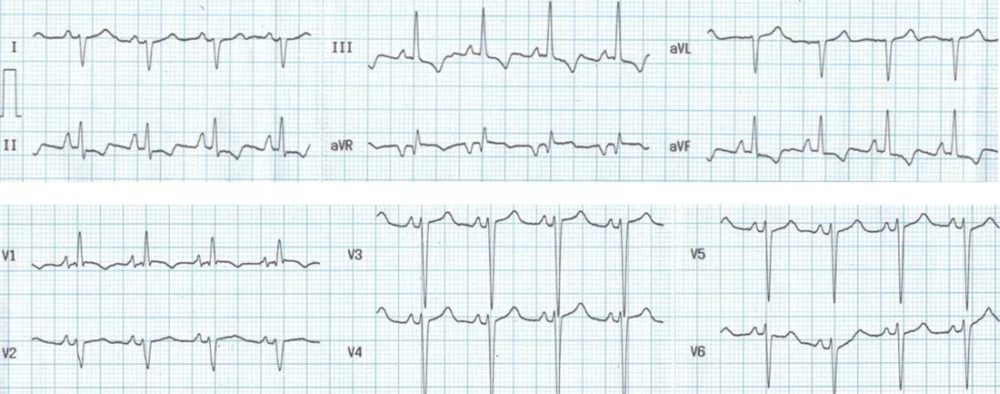
Sokolow-Lyon criteria for left ventricular hypertrophy is one of the commonly used, though not very specific. It can be stated as follows: S wave in V1 + R wave in lead V5 or V6 > 3.5 mV or R wave in V5 or V6 > 2.6 mV. This is based on the tall R waves noted in leads facing the left ventricle and deep S waves in leads facing right ventricle, noted in left ventricular hypertrophy. The ECG diagnosis of left ventricular hypertrophy becomes more specific when it is accompanied by ST-T changes indicating left ventricular strain (ST depression with T wave inversion) as seen in the image below.
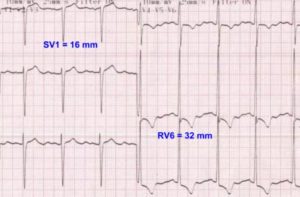
ECG showing left ventricular hypertrophy with strain pattern and illustrating Sokolow-Lyon criteria
The strain pattern in seen in conditions producing left ventricular pressure overload (systolic overload) as in hypertension and aortic stenosis. In conditions causing left ventricular volume overload (diastolic overload), the ST segment shows mild concave upward elevation, associated with tall T waves and a narrow initial q wave.
Severe left ventricular hypertrophy with strain pattern in severe aortic stenosis: ECG showing gross left ventricular hypertrophy (LVH) with strain in case with severe aortic stenosis. The R waves in V5 and V6 are so tall that they are overlapping with the tracing in the channel above. ST segment depression and T wave inversion are seen in inferior and lateral leads. This is a pressure overload pattern which can be seen also in severe systemic hypertension and hypertrophic obstructive cardiomyopathy. In hypertrophic obstructive cardiomyopathy there may be associated prominent Q waves due to septal hypertrophy. In volume overload pattern the ST segment depression and T wave inversion are not usually seen while the R waves will be tall in lateral leads and the T waves upright and tall. A small narrow q wave is also seen in in volume overload patterns due to aortic regurgitation or patent ductus arteriosus / ventricular septal defect with large left to right shunt. LVH with strain pattern can sometimes be seen in long standing severe aortic regurgitation, usually with associated left ventricular hypertrophy and systolic dysfunction.
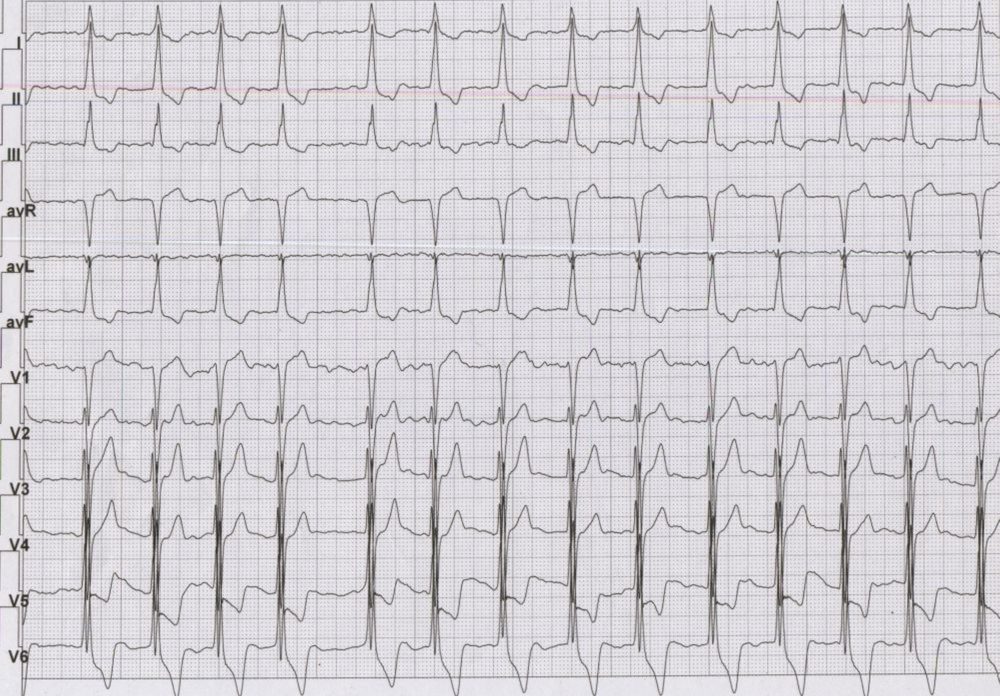
ECG in hypertrophic cardiomyopathy with atrial fibrillation: Atrial activity is seen as irregular fibrillary waves suggesting atrial fibrillation. The QRS complexes have a large amplitude in chest leads overlapping between the leads. Tall R waves in lateral leads and deep S waves in anterior leads along with gross ST segment depression with T wave inversion in lateral leads are suggestive of severe left ventricular hypertrophy. The QRS width is also increased to about 120 msec mimicking left bundle branch block. The ECG is from a case of advanced hypertrophic cardiomyopathy with atrial fibrillation. Development of atrial fibrillation leads to cardiac decompensation in hypertrophic cardiomyopathy due to loss of atrial kick. In a hypertrophied ventricle the booster effect of atrial contraction is very important for diastolic filling. Even though the contribution of atrial contraction to ventricular filling in a normal person is about 15 – 20 %, it may be over 30% in an individual with diastolic dysfunction as in hypertrophic cardiomyopathy. When the ventricular filling decreases, it reduces the cardiac output as well as an increase in the left ventricular outflow obstruction. This is because the severity of left ventricular outflow tract obstruction increases when the ventricular cavity size decreases.
Biventricular hypertrophy
Biventricular hypertrophy can be considered if patterns of both left ventricular hypertrophy and right ventricular hypertrophy are seen together. But hypertrophy of one ventricle can sometimes mask the ECG changes due to hypertrophy of the other ventricle. One specific type of biventricular hypertrophy pattern seen in children with congenital heart disease is known as Katz Wachtel phenomenon. In this condition, tall biphasic QRS complexes are noted in mid precordial leads. This is seen classically in large ventricular septal defect with hyperdynamic pulmonary hypertension. Recordings have to be obtained at half standardization (5 mm/mV) to prevent overlap between the QRS complexes of the different leads so that the voltages can be measured accurately. In the ECG shown below, I and aVL are negative, indicating right axis deviation.
Katz Wachtel phenomenonECG showing tall biphasic complexes in mid precordial leads suggesting Katz Wachtel phenomenon