Colour Doppler Echocardiogram in Mitral Stenosis
Colour Doppler Echocardiogram in Mitral Stenosis
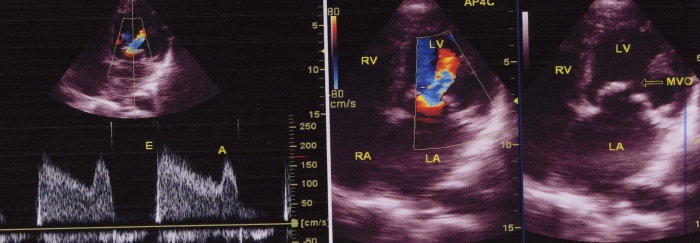
First panel shows pulsed Doppler tracing in the lower half with an early diastolic E wave and a late diastolic A wave (during atrial systole). In normal persons, there will be a gap between the two waves, when the atrial and ventricular diastolic pressures are equal (diastasis). Diastasis is absent in mitral stenosis as the pressures do not equalize – left atrial pressure is always higher and there is a gradient throughout diastole.
Mitral valve area can be estimated from the downward slope of the E wave. The slope becomes more flat as the severity of the mitral stenosis increases. The pressure half time of the descend of the E wave is calculated by the computerized algorithm in the echocardiograph. The PHT is the time taken for the peak pressure gradient to fall by half (or the velocity to fall by a factor of root 2). Mitral valve area of 1 sq. cm corresponds to a PHT of 220 ms. Hence dividing 220 by the measured pressure half time gives the estimated mitral valve area by PHT. In severe mitral stenosis, the slope is flat and the pressure half time longer, giving a smaller valve area by PHT.
The A wave will be absent if there is atrial fibrillation as in the ECG. The upper half of the first panel shows a color Doppler image in the apical four chamber view with a mosaic (turbulent) jet from the mitral valve into the left ventricle. The mosaic jet is due to the high velocity across the stenotic mitral valve.
Second panel shows two pictures, one with colour flow mapping and another without. The colour flow mapping shows the turbulent flow from left atrium to left ventricle through the stenosed mitral valve. The domed mitral leaflets in the open position with a narrow orifice is visible in the frame without colour flow mapping. Doming of the mitral valve is due to commissural fusion preventing full opening of the mitral leaflets in diastole. Both images are in the apical four chamber view.
Related Posts


About The Author
Johnson Francis
Former Professor of Cardiology, Calicut Govt. Medical Kozhikode, Kerala, India. Editor-in-Chief, BMH Medical Journal