All About Cardiovascular System and Disorders

Menu
  • Cardiology
    • Angiography and Interventions
      • Coronary Interventions
      • Peripheral Interventions
      • Structural Heart Disease Interventions
    • Cardiac CT scan
    • Cardiac Magnetic Resonance imaging
    • Cardiac rehabilitation
    • Cardiac Surgery
    • Cardio Oncology
    • Cardiology Basics
    • Cardiology Basics
    • Cardiology MCQ
      • DM / DNB Cardiology Entrance
    • Cardiology X-ray
    • Cardiomyopathy
    • Clinical Trial Review
    • ECG / Electrophysiology
      • ECG Library
    • Echocardiography
      • Echocardiogram Library
    • General Cardiology
    • HBC
    • Machine Learning and AI in Cardiology
    • Nuclear Cardiology
      • Positron emission tomography
    • Onco Cardiology
    • Peripheral Vascular Disease
  • Heart Disease FAQ
  • Medicine MCQ – CVS

Evolved inferior wall myocardial infarction – ECG
Johnson Francis | September 19, 2018 | ECG / Electrophysiology, ECG Library | No Comments

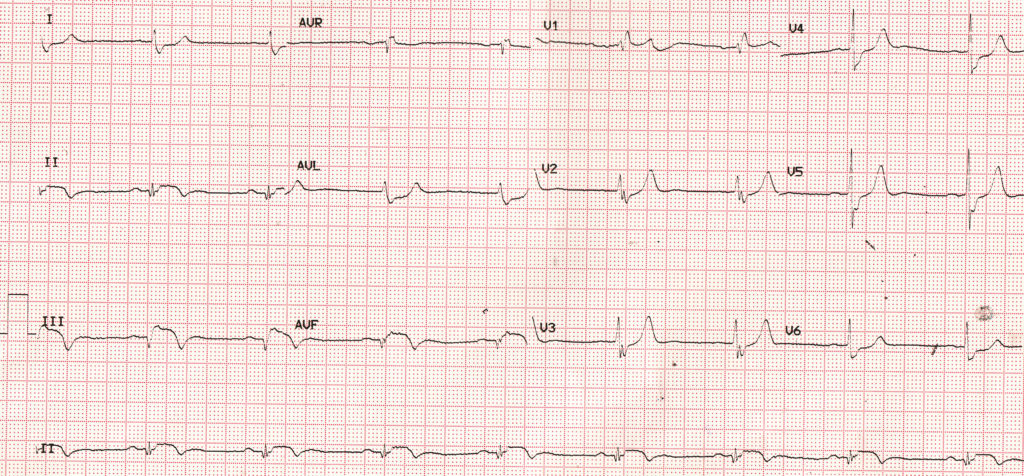
Evolved inferior wall myocardial infarction – ECG

Evolved inferior wall myocardial infarction - ECG
Evolved inferior wall myocardial infarction – ECG

Click here for a larger image

ECG shows sinus bradycardia at 50/min, which is common in inferior wall infarction due to enhanced vagal activity, a usual association of inferior wall infarction. In fact inferior wall infarction is considered to be the commonest pathological cause of sinus bradycardia [1].

PR interval is 200 ms, which is the upper limit of normal. AV blocks are also quite common in inferior wall infarction as the right coronary occlusion which is often the cause of inferior wall infarction, also impairs the AV nodal blood supply.

Pathological Q waves are noted in inferior leads (II, III and aVF). Pathological Q waves have a width of at least 40 ms and an amplitude of at least 25% of the ensuing R wave [2]. Although these are the ‘classic criteria‘, other criteria known as TIMI (Thrombolysis In Myocardial Infarction) criteria and consensus 2000 and consensus 2007 criteria are also there [2]. TIMI criteria looks at R wave in addition to Q waves. According to TIMI criteria any Q wave of 30 ms or more duration in two contiguous leads, any Q or R wave of 10 ms or less width and 0.1 mV or less amplitude in lead V2 and R wave of 40 ms or more width in V1 are of similar significance.

Inferior leads (II, III and aVF) show the classical coved ST segment elevation along with T wave inversion. ST segment depression is noted in I, aVL and V6, which is often considered as reciprocal ST depression, though the jury is still out whether it represents ischemia at a distance.

ST segment elevation is more in lead III compared to lead II. This finding would suggest right coronary artery as the culprit vessel. If there is associated ST segment elevation in V1 indicating right ventricular infarction, it becomes a powerful marker of occlusion of right coronary artery in the proximal or mid segment [3]. In inferior wall infarction due to left circumflex coronary artery occlusion, ST elevation in lead II is higher than that in lead III.

In addition to these findings, an rsR’ pattern in V1 and slurred S waves in I, aVL and other lateral leads are seen. The QRS width is 120 ms. These findings indicate a right bundle branch block, which is not usual in inferior wall infarction and may represent an independent finding.

References

  1. Da Costa D, Brady WJ, Edhouse J. Bradycardias and atrioventricular conduction block. BMJ. 2002 Mar 2;324(7336):535-8.
  2. Delewi R, Ijff G, van de Hoef TP, Hirsch A, Robbers LF, Nijveldt R, van der Laan AM, van der Vleuten PA, Lucas C, Tijssen JG, van Rossum AC, Zijlstra F, Piek JJ. Pathological Q Waves in Myocardial Infarction in Patients Treated by Primary PCI. JACC Cardiovasc Imaging. 2013 Mar;6(3):324-31.
  3. Zimetbaum PJ, Krishnan S, Gold A, Carrozza JP 2nd, Josephson ME. Usefulness of ST-segment elevation in lead III exceeding that of lead II for identifying the location of the totally occluded coronary artery in inferior wall myocardial infarction. Am J Cardiol. 1998 Apr 1;81(7):918-9.
Tags:Pardee's sign, Pardee's sign in acute myocardial infarction, Pardee's sign on ECG

Related Posts

  • Lowest risk SQTS genotype – Cardiology MCQ Lowest risk SQTS genotype – Cardiology MCQ
    No Comments | Nov 20, 2014
  • Strategies for prevention of SCD at community level
    No Comments | Oct 3, 2008
  • Myocardial edema the cause of Wellens’ ECG pattern?
    No Comments | Apr 23, 2012
  • P Tricuspidale
    No Comments | Mar 13, 2015

About The Author

Johnson Francis

Former Professor of Cardiology, Calicut Govt. Medical Kozhikode, Kerala, India. Editor-in-Chief, BMH Medical Journal

Categories

  • Angiography and Interventions
  • Cardiac CT scan
  • Cardiac Magnetic Resonance imaging
  • Cardiac rehabilitation
  • Cardiac Surgery
  • Cardio Oncology
  • Cardiology
  • Cardiology Basics
  • Cardiology Basics
  • Cardiology MCQ
  • Cardiology X-ray
  • Cardiomyopathy
  • Clinical Trial Review
  • Coronary Interventions
  • DM / DNB Cardiology Entrance
  • ECG / Electrophysiology
  • ECG Library
  • Echocardiogram Library
  • Echocardiography
  • General Cardiology
  • HBC
  • Heart Disease FAQ
  • Machine Learning and AI in Cardiology
  • Medicine MCQ – CVS
  • Nuclear Cardiology
  • Onco Cardiology
  • Peripheral Interventions
  • Peripheral Vascular Disease
  • Positron emission tomography
  • Structural Heart Disease Interventions

Disclaimer

This site is not meant for any medical advice or treatment decisions. If you have a medical condition, please contact your physician for advice. We do not endorse any products or services appearing on the site as advertisements. We do not intentionally collect or store any personal information. Third party services displaying ads may collect anonymized information over which we have no control. If you feel that it is not acceptable to you, please do not continue on this site.

Author: Johnson Francis, MBBS, MD, DM, Former Professor of Cardiology, Calicut Govt. Medical Kozhikode, Kerala, India. Editor-in-Chief, BMH Medical Journal

MELD and MELD-XI Scores

Calculation of Intracardiac Shunts by Cardiac Cath and Flamm Formula

How can you know if the Holter monitor stops recording?

Locomotor Brachii

Anatomy of the Mitral Valve

Nitric Oxide Synthase: nNOS, iNOS, eNOS

© 2025 All About Cardiovascular System and Disorders.
  • About
  • Devoted to the Cardiovascular Profession
  • ECG Basics – A Brief Review
    • Basic Principles of Electrocardiography
    • Chamber Enlargements
    • Electrical Axis
    • Monitoring Leads and Special Leads
    • Recording a Good ECG
    • Sinoatrial and Atrioventricular Conduction Defects
    • Supraventricular Arrhythmia – Part 1
    • Supraventricular Arrhythmia – Part 2
    • Twelve Lead ECG
    • Ventricular Arrhythmia
  • Privacy Policy
Go to mobile version