Hemodynamic quiz
Hemodynamic quiz
Here are the simultaneous pressure tracings from the aorta and the left ventricle. What is the interpretation?
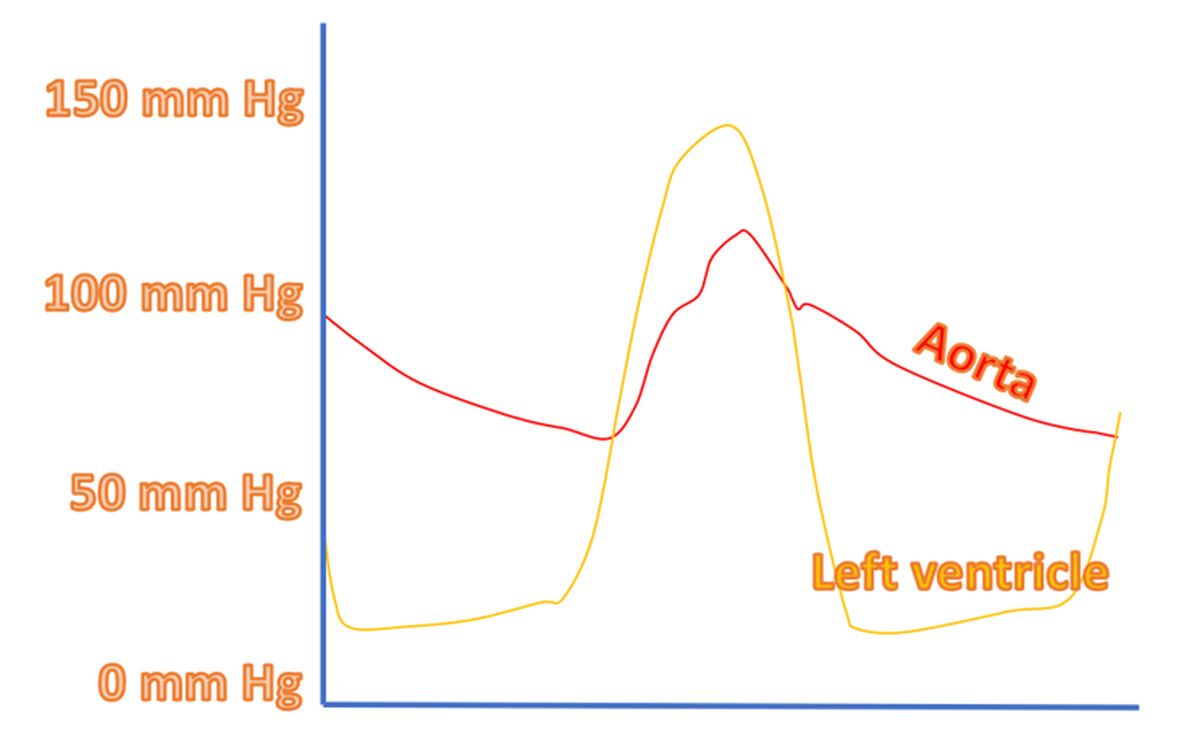
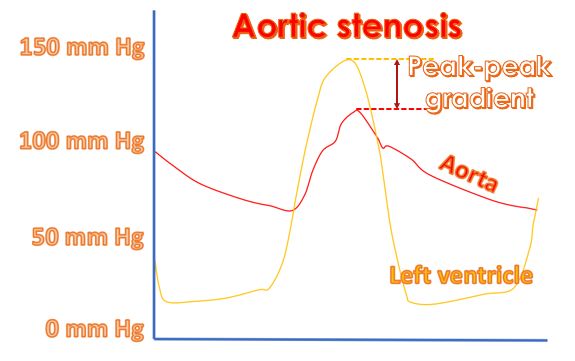
The tracings show a gradient between the left ventricle and aorta. Peak left ventricular pressure is significantly higher than the peak aortic pressure. Normally the difference between the two pressures is negligible. The difference is known as peak to peak gradient.
This pattern of pressure tracings is seen in valvar aortic stenosis. In hypertrophic obstructive cardiomyopathy, the aortic tracing will show a spike and dome pattern with an initial rapid upstroke. In valvar aortic stenosis it is a delayed (tardus) and reduced (parvus) upstroke corresponding to the pulsus parvus et tardus.
Two catheters are needed to record simultaneous pressure tracings. Recording of the femoral sheath side arm pressure should not be used as a surrogate of aortic pressure.
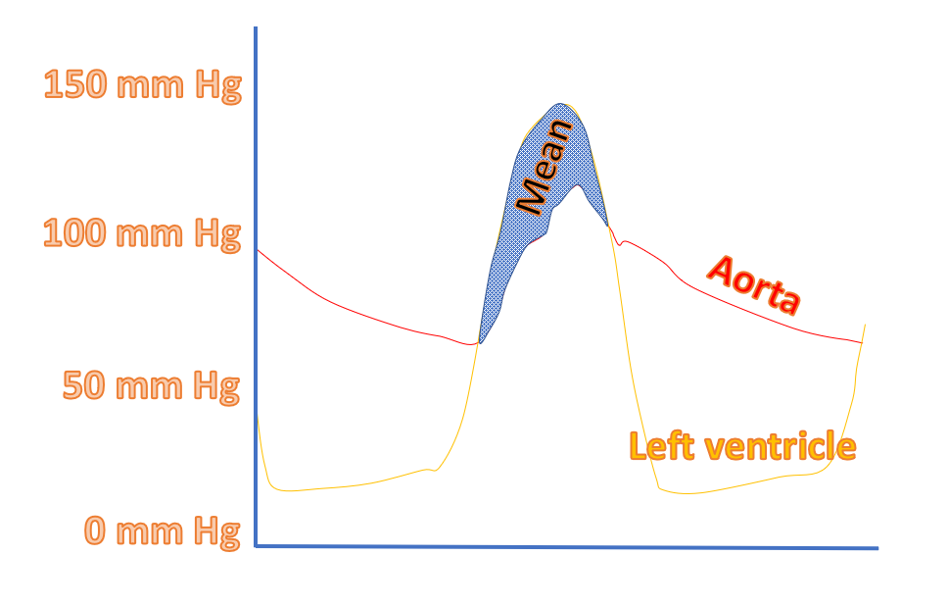
Peak to peak gradient is not an ideal measure to assess the severity of aortic stenosis as the peaks of aortic and left ventricular pressures occur at different times. An electronic mean gradient is calculated using computer processing. Earlier it used to be measured by manual planimetry on a print out taken on graph paper.
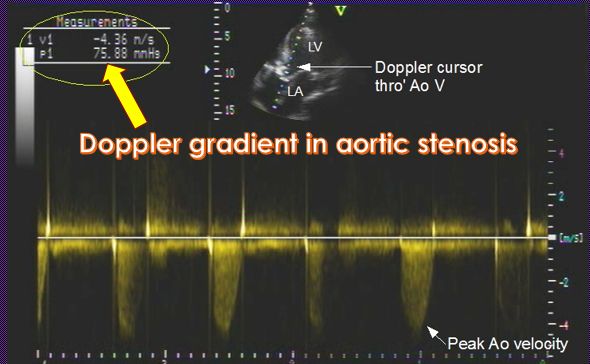
The gradient measured on Doppler echocardiography is peak instantaneous gradient and not peak to peak gradient. Carabello effect is due to the enhanced obstruction across the aortic valve when the catheter is in the left ventricle in critical aortic stenosis. This can be observed as a rise in the aortic pressure when the catheter is pulled back from the left ventricle.
Related Posts

About The Author
Johnson Francis
Former Professor of Cardiology, Calicut Govt. Medical Kozhikode, Kerala, India. Editor-in-Chief, BMH Medical Journal