Identification of culprit vessel from ECG
Identification of culprit vessel from ECG
Identification of culprit vessel or infarct artery localization from ECG is useful during primary angioplasty. The initial diagnostic angiogram shot is taken in the artery which is not the culprit vessel, with a diagnostic catheter. Guide catheter is used for diagnostic shot in the suspected culprit vessel after that. This saves time during primary angioplasty.
Have a look at the ECG below:
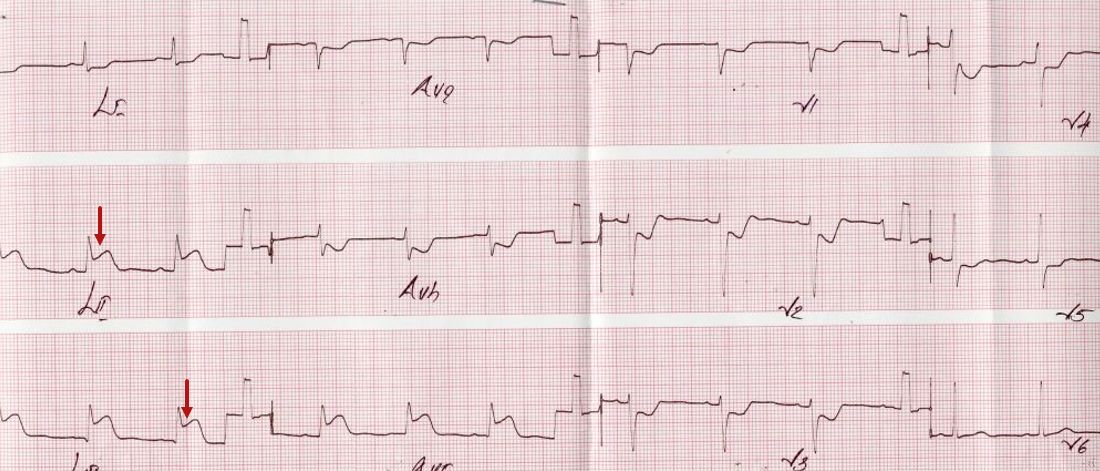
It shows show ST segment elevation in leads II, III and aVF of about 3mm. ST segment depression is seen in leads I, aVL and V1 to V5. Overall features are suggestive of hyperacute phase of inferior wall myocardial infarction with “reciprocal” ST segment depression in anterior leads.
Here is the left coronary angiogram of that person:
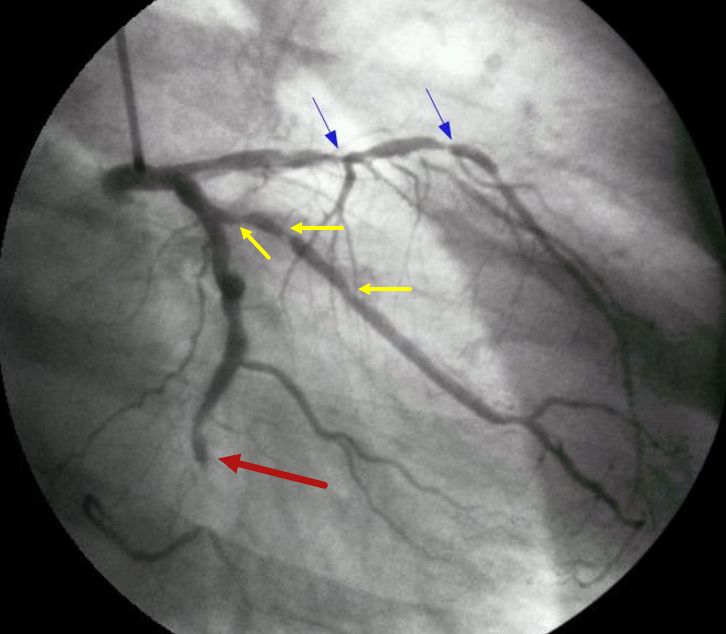
Left coronary angiogram shows total occlusion of distal left circumflex coronary artery with absent dye filling in a short segment (black arrow). Multiple significant lesions are seen in left anterior descending coronary artery (blue arrows). Significant lesions are also seen in the obtuse marginal branch of the left circumflex coronary artery (yellow arrows). The culprit lesion which has caused the infarction in this case is possibly the left circumflex occlusion. Generally, the ST elevation is more in lead III in right coronary occlusion while it is more in lead II in left circumflex occlusion. In this case, we have almost equal ST elevation in leads II and III. But the discussion does not stop there. Have a look at the right coronary angiogram below:
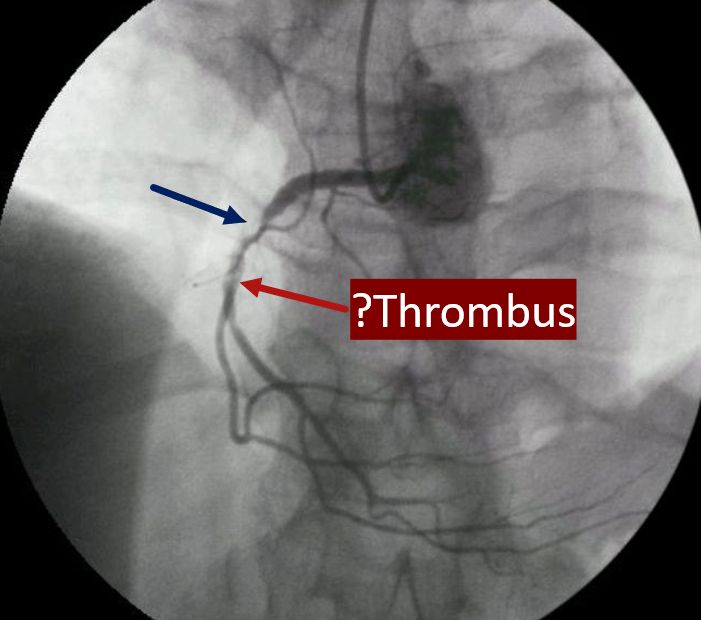
Right coronary angiogram shows a critical lesion (black arrow) with some negative shadows distal to the lesion, suggesting thrombus. We may be tempted to believe that this is the culprit lesion which has caused the inferior wall infarction if the LCX lesion was not found. This case demonstrates a limitation of localization of culprit vessel from ECG.
Here is another similar ECG:
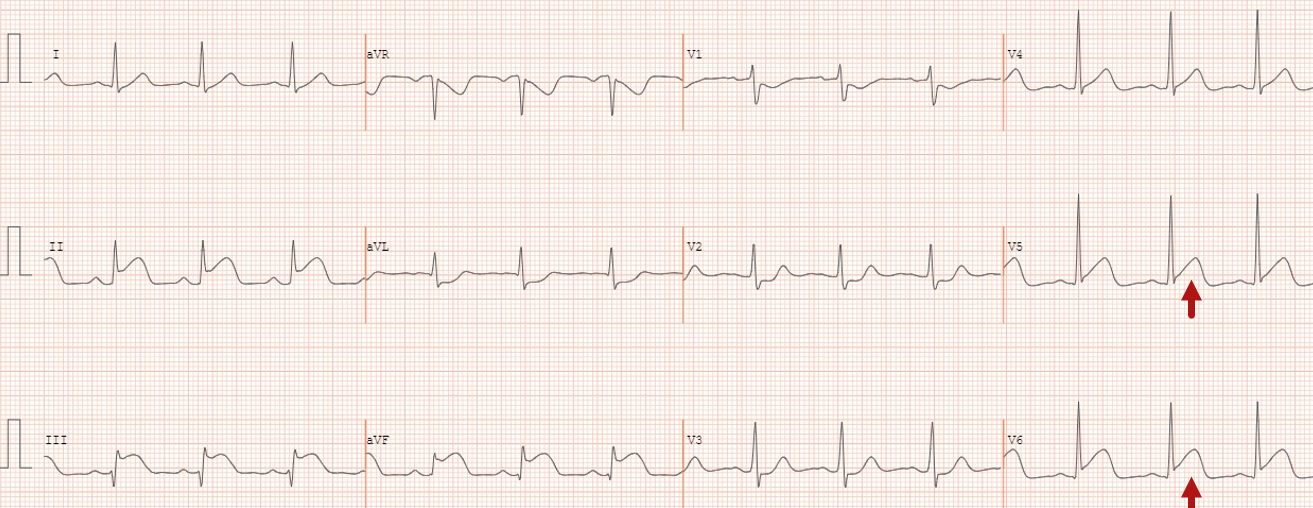
But there is mild ST elevation in V5 and V6, in addition to inferior ST elevation, which makes left circumflex lesion more likely. aVL shows minimal ST depression. So does V1 and V2.
Check out another ECG here:
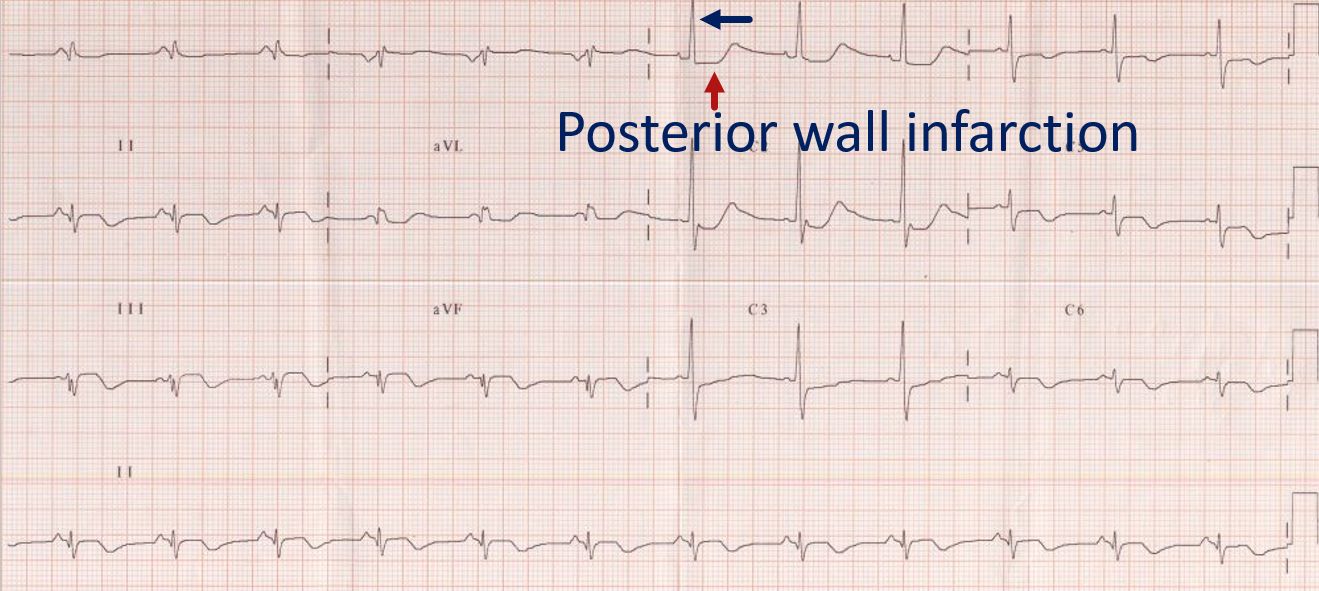
In this ECG, ST segment elevation and T wave inversion are present in II, III and aVF, the inferior leads. The ST segment is coved, and T waves are inverted in V5 and V6, the lateral leads. Minimal ST segment depression is seen in lead I and aVL, which can be taken as reciprocal to the ST segment elevation in inferior leads. There are tall R waves in V1 and V2 with R/S ratio more than 1, and ST segment depression with upright T waves. These features are suggestive of posterior wall infarction, being the inverse of Q wave, ST elevation and T wave inversion which would have been recorded in a posterior lead. There is also loss of r wave amplitude in V5, V6. Together with the changes in inferior and lateral leads, the full diagnosis is inferior, posterior, and lateral wall infarction. This combination can occur in occlusion of a dominant left circumflex coronary artery which supplies the inferior, posterior, and lateral walls of the left ventricle.
The angiograms discussed in the first case had an occlusion of a dominant left circumflex coronary artery. Right coronary artery was small and non-dominant. The full extent of supply by left circumflex can only be seen after opening the occlusion.
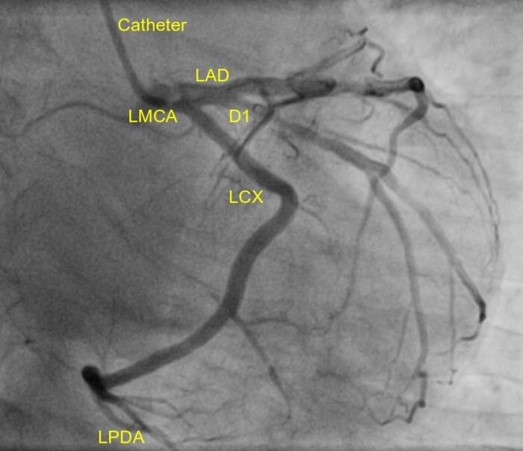
Here is a left coronary angiogram, showing dominant left circumflex with left posterior descending artery arising from it (LPDA):
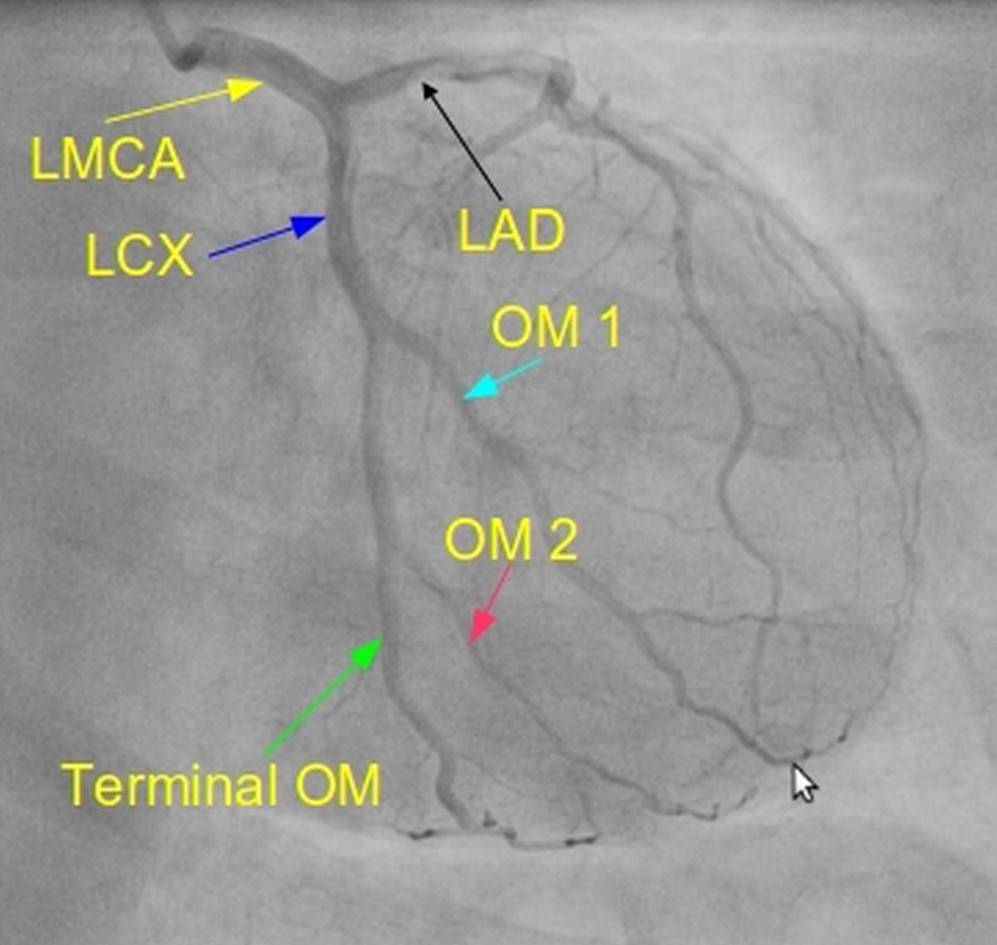
Here it is a non-dominant left circumflex, and it gives only obtuse marginal branches and no LPDA:
This is how a dominant RCA will look like, much larger and giving rise to posterior descending and posterior left ventricular branches:
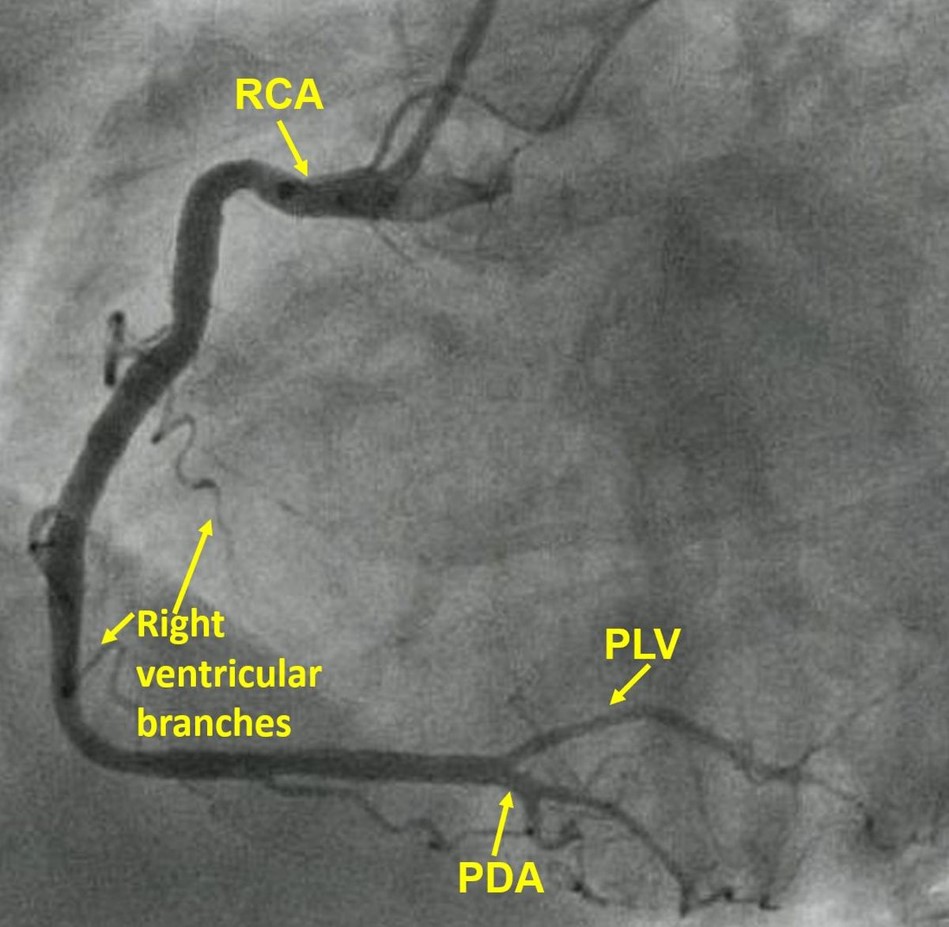
Right ventricular branches are also seen. If there is a proximal occlusion, inferior wall infarction is associated with right ventricular infarction. RV infarction manifests with ST elevation in right precordial leads. Right precordial ST elevation can also occur in anterior wall infarction due to left anterior descending artery occlusion. But in LAD occlusion, ST elevation in V2 is more than that in V1. In right ventricular infarction, more ST elevation is noted in V3R than in V1. V1 can show ST elevation in both these cases.
Now what about this ECG?
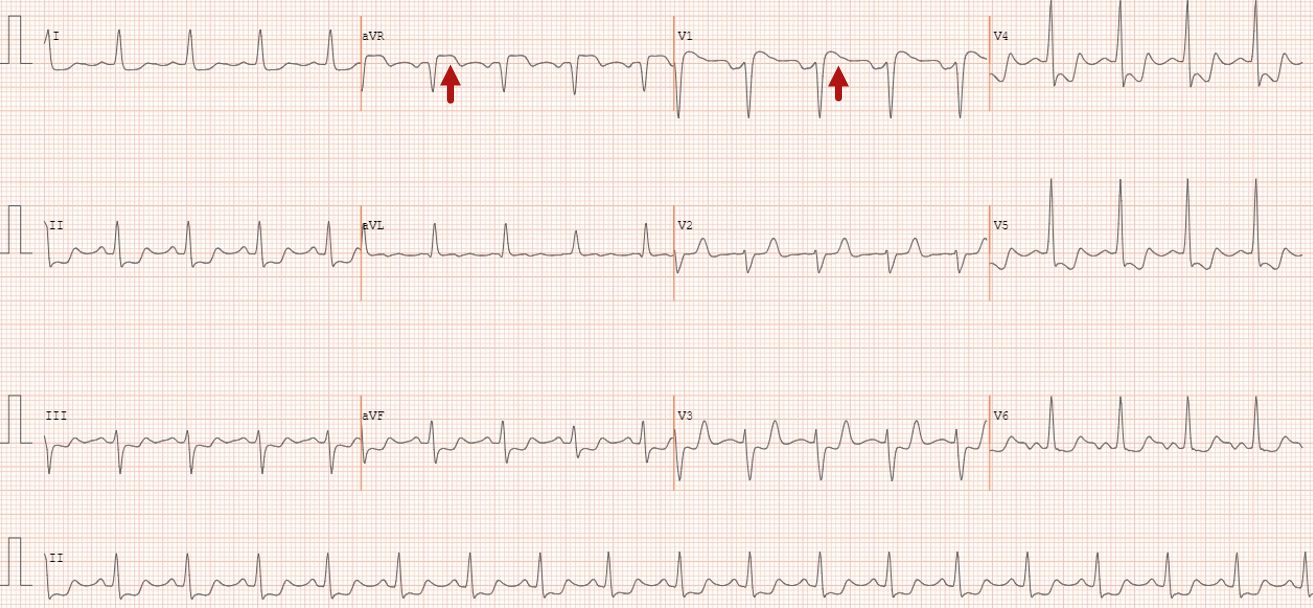
ECG shows sinus rhythm at around 100/min, with ST segment elevation in aVR and V1. ST depression is seen in I, II, III, aVF, V3-V5. Maximum ST depression is noted in V4 and V5 and it is down sloping. Duration of ST elevation in aVR is more than that in V1. Overall, it is likely to be due to left main coronary artery disease. Alternate option is proximal multivessel coronary stenosis. But proximal left anterior descending coronary artery stenosis should have produced some ST elevation in V2. Here ST segment is isoelectric in V2.
Another ECG from a person with persistent anginal pain for the past several hours showing significant ST segment depression in anterolateral leads along with sinus tachycardia:
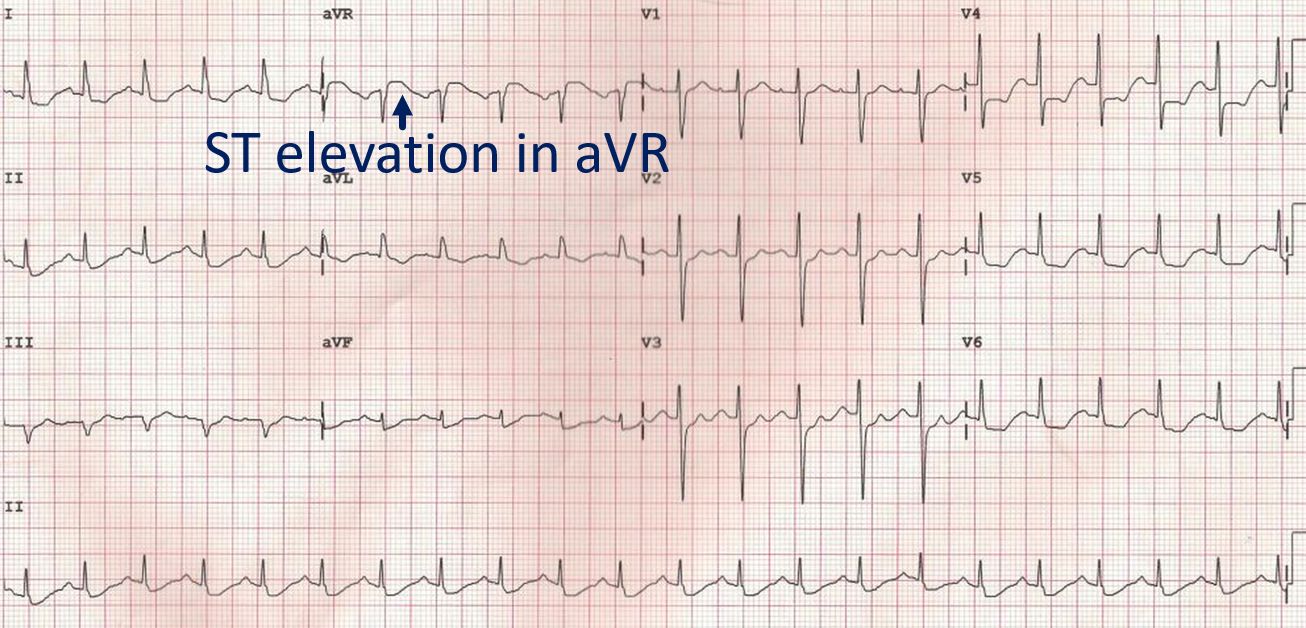
ST segment elevation is noted in aVR. Such a pattern is consistent with significant left main coronary artery stenosis. Clinical evaluation and X-Ray chest showed features of pulmonary edema. Angiography done after initial stabilization with intensive medical management showed severe stenosis of distal left main coronary artery along with multiple lesions in all the three vessels.
Classical ECG pattern in left main coronary artery disease is ST segment elevation in aVR with extensive ST depression in other leads, most prominent in I, II and V4-V6. ST elevation may be noted in V1, but ST elevation in aVR is more than or equal to that in V1 [1,2].
One more ECG suggestive of LMCA disease:
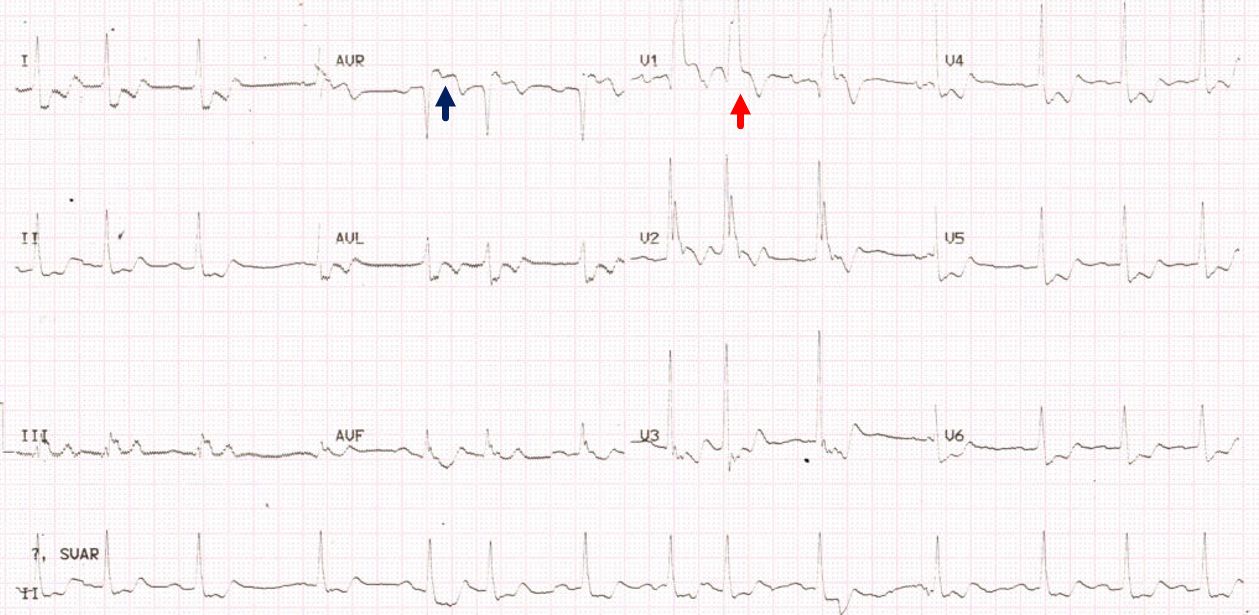
This ECG shows ST elevation in aVR and V1 along with ST depression in inferior and lateral leads. ST elevation in aVR more than that in V1 is also suggestive of left main disease. In addition to ST elevation in aVR, this ECG also shows Q in V1 followed by a tall, slurred R (QRBBB) is indicative of anterior wall infarction with right bundle branch block. The initial R of the RSR’ pattern expected in right bundle branch block (RBBB) is knocked off by the infarction. Multiple supraventricular ectopics are also seen in the ECG.
In a study comparing acute obstruction of left main, left anterior descending and right coronary occlusions, aVR ST elevation of more than 0.05 mV was noted in 88% of LMCA obstruction, 43% of LAD obstruction and 8% of RCA obstruction [2].
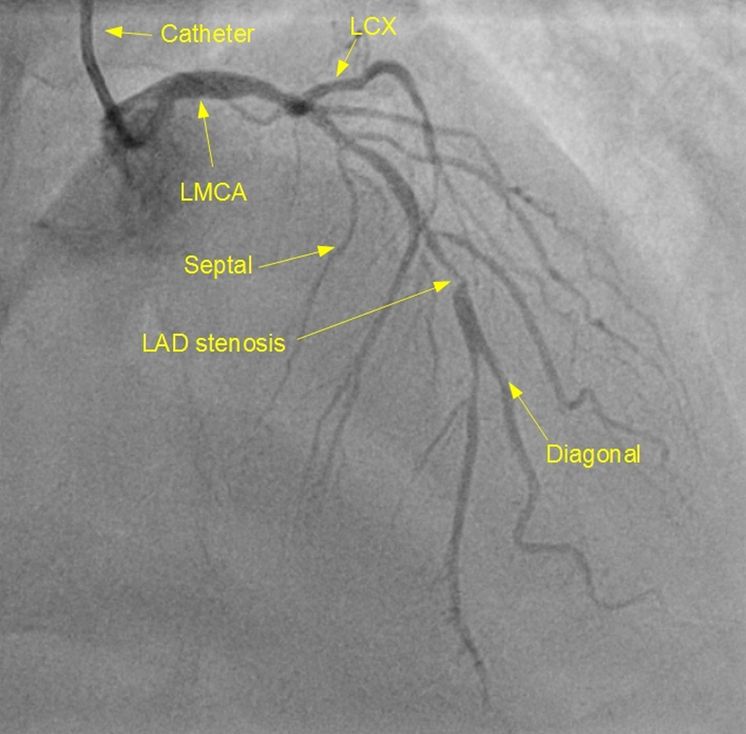
This is a left coronary angiogram, focusing on the branches of left anterior descending coronary artery (LAD). Diagonal and septal branches are seen.
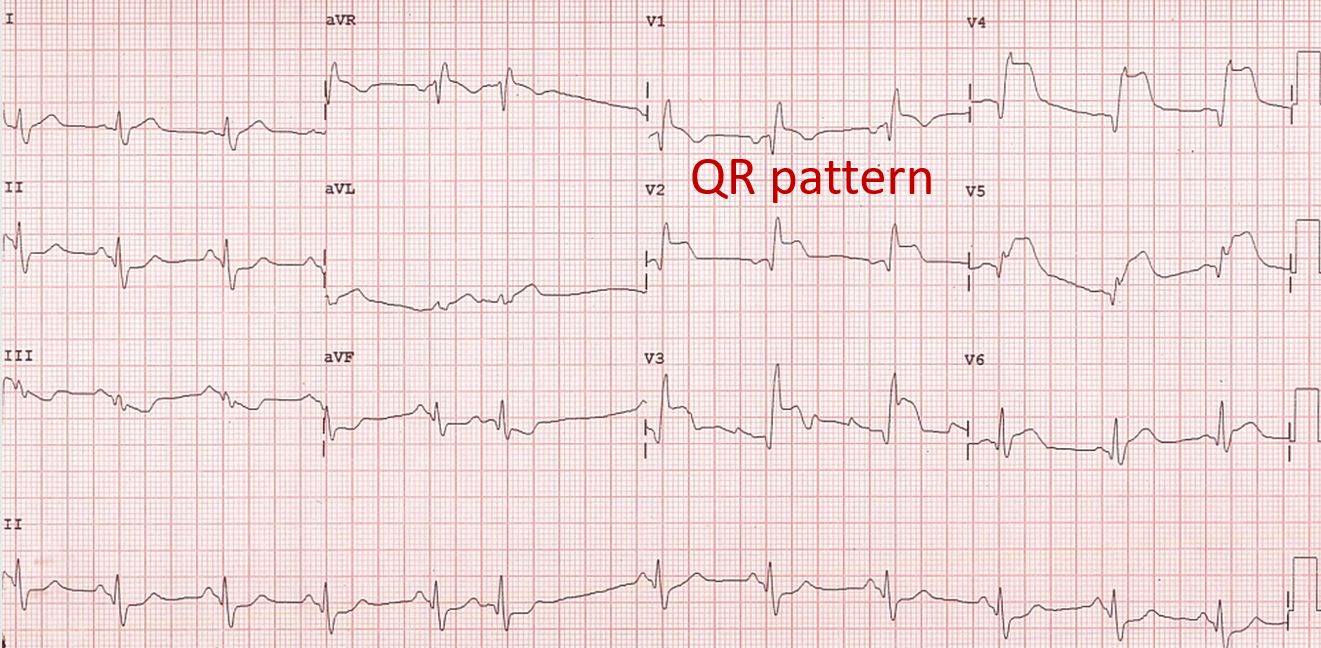
ECG showing acute anterior wall myocardial infarction with RBBB. Gross ST segment elevation is seen in anterior leads, with maximum of 0.7 mV elevation in V4. QR pattern in V1 suggests anterior wall infarction with right bundle branch block. RBBB with an initial Q due to anterior wall infarction is called QRBBB and indicates proximal occlusion of left anterior descending coronary artery. Presence of QRBBB is associated with more extensive myocardial infarction and higher mortality.
In a study, ST elevation in aVR, RBBB, ST depression in V5 and ST elevation in V1 more than 2.5 mm strongly suggested LAD occlusion proximal to first septal [3].
Same study showed that abnormal Q wave in aVL was association with occlusion proximal to first diagonal branch. Occlusion distal to D1 had ST depression in aVL. For both S1 and D1, inferior ST depression of 1 mm or more predicted proximal LAD occlusion and absence of it, distal occlusion.
Sometimes a small area of myocardial infarction can present with ST elevation in I and aVL, sparing V5 and V6 which are seen usually together in lateral wall myocardial infarction. Such a small infarct has been called high lateral wall infarction.
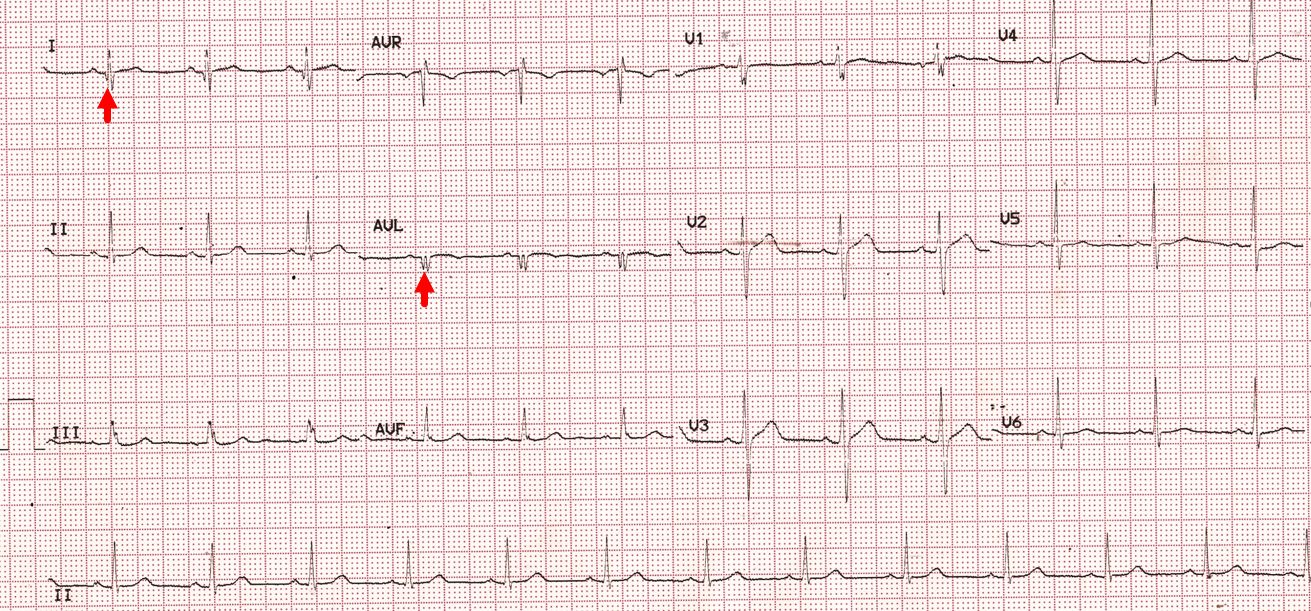
This ECG shows high lateral wall infarction with Q waves in I and aVL, but not in V5 or V6. Coved ST segment elevation (minimal) and shallow T inversion are seen in aVL. This could be due to occlusion of a diagonal branch of left anterior descending coronary artery or an obtuse marginal branch of the left circumflex coronary artery.
References
- Sen F, Ozeke O, Kirbas O, Burak C, Kafes H, Tekin Tak B, Ozdamar U, Ocak K, Topaloglu S, Aras D. Classical electrocardiographic clues for left main coronary artery disease. Indian Heart J. 2016 Sep;68 Suppl 2(Suppl 2):S226-S227.
- Yamaji H, Iwasaki K, Kusachi S, Murakami T, Hirami R, Hamamoto H, Hina K, Kita T, Sakakibara N, Tsuji T. Prediction of acute left main coronary artery obstruction by 12-lead electrocardiography. ST segment elevation in lead aVR with less ST segment elevation in lead V(1). J Am Coll Cardiol. 2001 Nov 1;38(5):1348-54.
- Engelen DJ, Gorgels AP, Cheriex EC, De Muinck ED, Ophuis AJ, Dassen WR, Vainer J, van Ommen VG, Wellens HJ. Value of the electrocardiogram in localizing the occlusion site in the left anterior descending coronary artery in acute anterior myocardial infarction. J Am Coll Cardiol. 1999 Aug;34(2):389-95.
Related Posts

About The Author
Johnson Francis
Former Professor of Cardiology, Calicut Govt. Medical Kozhikode, Kerala, India. Editor-in-Chief, BMH Medical Journal