Cardiac CT image of pulmonary artery bifurcation
Cardiac CT image of pulmonary artery bifurcation
Contrast enhanced CT scan image at the level of the bifurcation of the main pulmonary artery into right pulmonary artery and left pulmonary artery. Ascending aorta and descending aorta are seen as two contrast filled circles anteriorly and posteriorly. Descending aorta is just to the left and anterior of the vertebra which is seen as a semicircular radio-opaque structure. Two elliptical radiolucent structures seen between the LPA and RPA are the left and right bronchi filled with air. This shows that the level of the section is below the tracheal bifurcation.
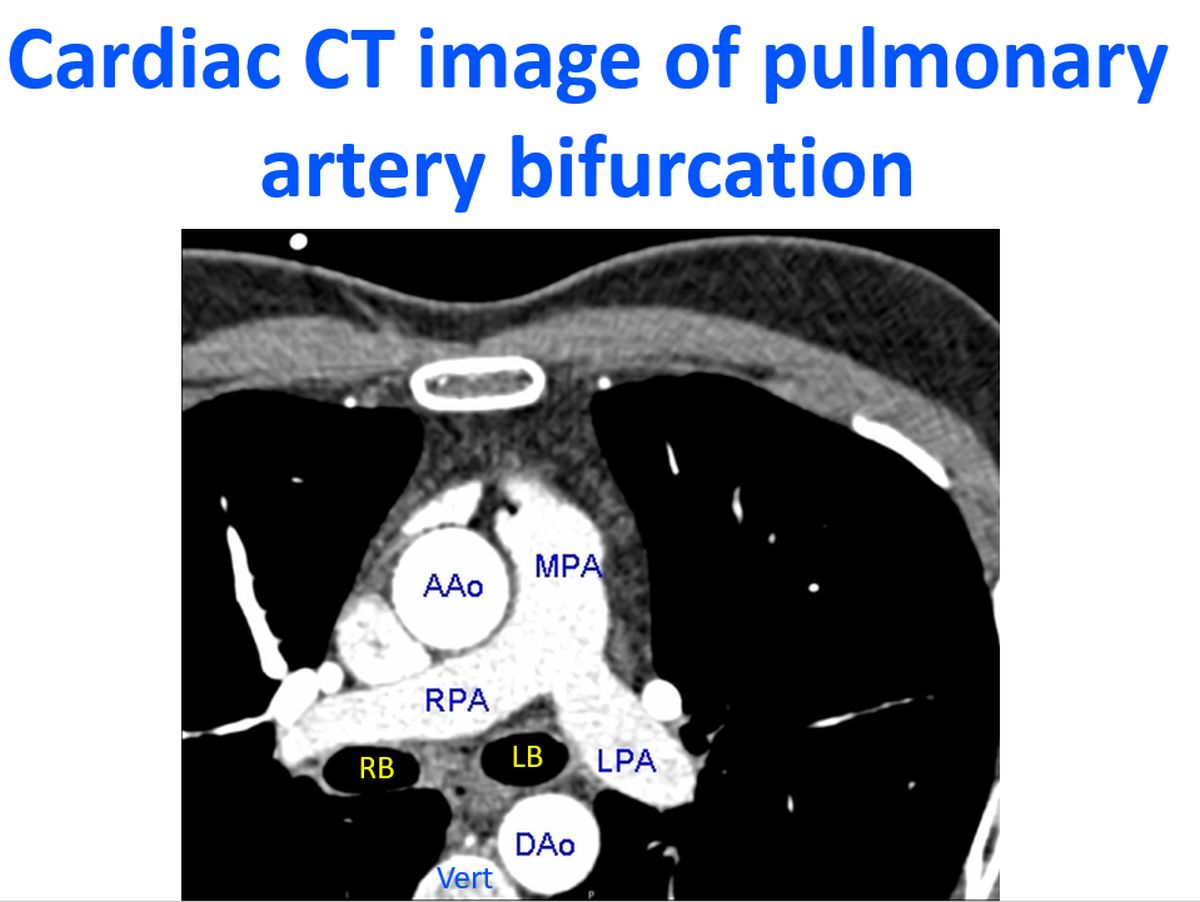
This is a good view to visualise pulmonary emboli in the main pulmonary artery or its proximal branches in cases of massive pulmonary embolism. Thrombi will be seen as filling defects in this contrast filled image. Aortic aneurysms can also be picked up in this view. To see the chest X-ray and CT scan of a saccular proximal descending aortic aneurysm, click here. The lung structure is not very clear in this image because the imaging window has been set to focus on the contrast filled vessels. In this radiological window, lung structures being air filled, are blackened out. Normal reference value of main pulmonary artery on non contrast enhanced CT has been given by the The Framingham Heart Study [1]. They gave it as 29 mm in males and 27 mm in females.
Reference
- Quynh A Truong, Joseph M Massaro, Ian S Rogers, Amir A Mahabadi, Matthias F Kriegel, Caroline S Fox, Christopher J O’Donnell, Udo Hoffmann. Reference Values for Normal Pulmonary Artery Dimensions by Noncontrast Cardiac Computed Tomography: The Framingham Heart Study. Circ Cardiovasc Imaging. 2012 Jan;5(1):147-54.
Related Posts

About The Author
Johnson Francis
Former Professor of Cardiology, Calicut Govt. Medical Kozhikode, Kerala, India. Editor-in-Chief, BMH Medical Journal