Chamber enlargements on ECG
Chamber enlargements on ECG
Atrial enlargement
The normal P wave has a maximum amplitude of 2.5 mm (0.25 mV) and a maximum width of 2.5 mm (100 ms). In right atrial enlargement, the amplitude increases while in left atrial enlargement, it is the width (duration) which increases. Both increases in biatrial enlargement. P wave abnormalities are best assessed in leads II and V1. Normal P wave is upright in lead II. In V1, a tiny initial spike is followed by a shallow negative wave.
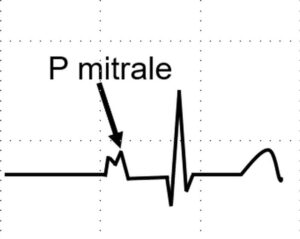
P mitrale: P mitrale is a notched and broad P wave with taller second peak indicating left atrial enlargement. It may be noted that initial part of P wave is contributed by right atrium as it is activated first and the second part by left atrium which is activated later. It is associated with a prominent negative deflection of P wave in V1, the left atrial component.
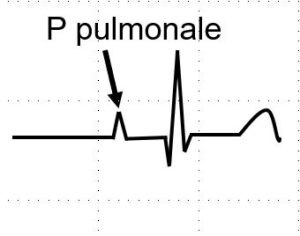
P pulmonale: Tall peaked P wave in right atrial enlargement is known as P pulmonale. It is found in cor pulmonale. The tall P of right atrial enlargement in congenital heart disease is called P congenitale. P wave axis is rightward in P pulmonale while it is leftward in P congenitale. The initial spike in V1 more than 1.5 mm in V1 is also a feature of right atrial enlargement. Initial peak of P wave in V1 more than 1.5 mm is also a feature of right atrial enlargement. Tall P in Ebstein’s anomaly is called Himalayan P wave.
P tricuspidale has been described in tricuspid atresia. The pattern is mirror image of P mitrale with initial peak taller than second peak. The P wave width and height are increased due to biatrial enlargement.
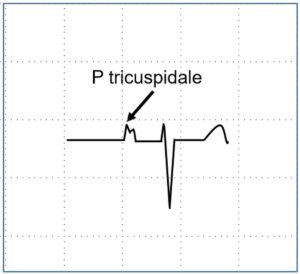
P tricuspidale
Ventricular enlargement
While atrial enlargement is manifest as changes in P wave, ventricular chamber enlargements are mainly manifest in the QRS complex. There can be secondary changes in the ST segment and T waves. Numerous named criteria have been described for ventricular enlargement, for which specialized books on electrocardiography may be kindly referred.
Left ventricular hypertrophy (LVH) is divided into left ventricular volume overload and pressure overload. Similarly right ventricular hypertrophy (RVH) is also divided into pressure and volume overload.
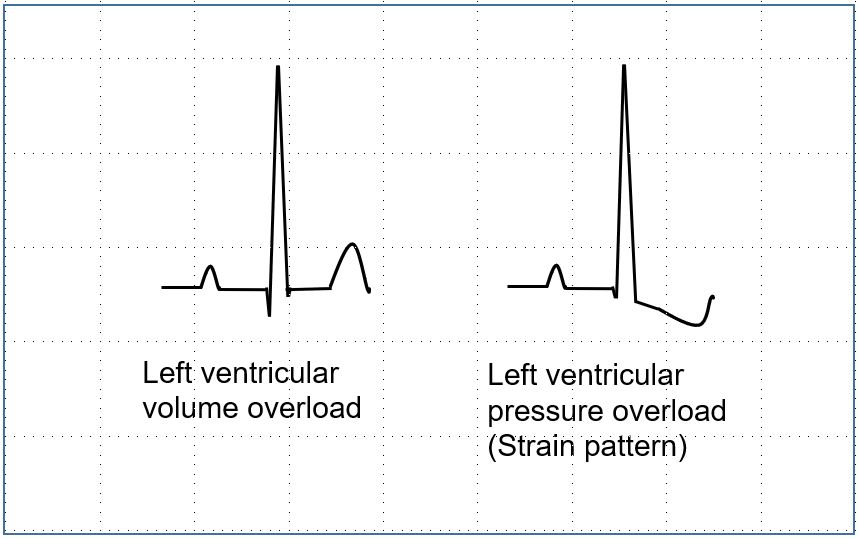
Left ventricular volume overload: Left ventricular volume overload is characterized by small narrow q waves, tall R waves with upright and tall T waves in lateral leads (V5, V6). Deep S waves are noted in leads V1, V2. Left ventricular volume overload is noted in mitral and aortic regurgitation as well as ventricular septal defect with large left to right shunt and patent ductus arteriosus.
Left ventricular pressure overload: Left ventricular pressure overload occurs in systemic hypertension, aortic stenosis and hypertrophic obstructive cardiomyopathy. In addition to tall R waves in lateral leads and deep S waves in V1, V2, there will be downsloping ST segment depression and T wave inversion (LVH strain pattern).
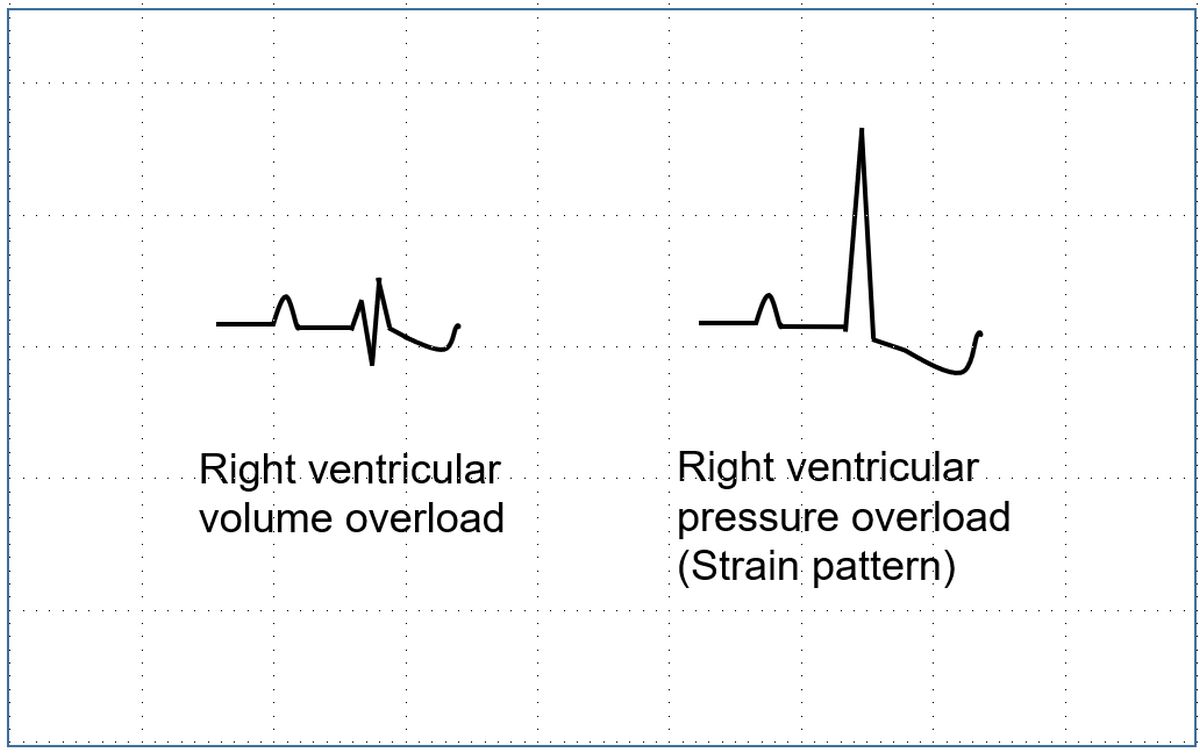
Right ventricular volume overload: Right ventricular volume overload is manifest by rSR’ pattern in V1 (incomplete right bundle branch block pattern). This is typically seen in atrial septal defect with large left to right shunt.
Right ventricular pressure overload: Right ventricular pressure overload manifests as tall R waves in V1 with ST depression and T inversion (RVH strain pattern), and deep S waves in V5, V6. In addition there may be right axis deviation of QRS axis.
About The Author
Johnson Francis
Former Professor of Cardiology, Calicut Govt. Medical Kozhikode, Kerala, India. Editor-in-Chief, BMH Medical Journal