Echocardiogram after TOF repair
Echocardiogram after TOF repair
Echocardiogram with video
Post TOF repair echo in PLAX view
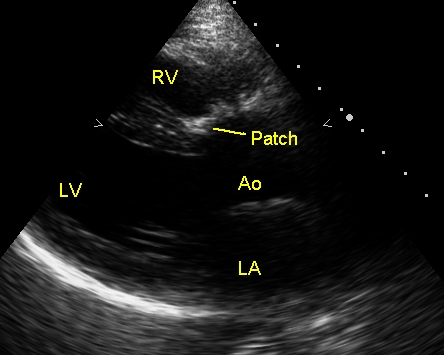
Echocardiogram after repair of Tetralogy of Fallot (TOF) from the parasternal long axis (PLAX) view showing the hyperechoic region of the patch which was used to close the ventricular septal defect. The aortic over-ride is no more present. Ao: aorta; RV: right ventricle; LV: left ventricle; LA: left atrium.
Post TOF repair M-mode echo
M-mode echocardiogram after repair of TOF showing the abnormal septal motion which is biphasic and not in line with the movement of the posterior wall which shows regular contractions and relaxations.
Mild PR after TOF repair
The signals above the baseline represent the reverse flow from the pulmonary artery into the right ventricular outflow tract in diastole due to pulmonary regurgitation (PR). The signal is incomplete partly because of the lack of complete alignment of the Doppler beam to the flow and partly because the regurgitation is only mild. In most cases of repaired TOF, there will be significant PR. In some cases it may be even severe enough to produce late right ventricular dysfunction. Here it is not that severe.
Pulmonary valve M-mode echocardiogram after TOF repair
M-mode echocardiogram of the pulmonary valve after TOF repair, showing almost normal pattern with an A wave just before the onset of systole. The diastolic portion of the movement is better seen than the systolic portion. The pulmonary valve echocardiogram shows a prominent (deep) A wave in pulmonary stenosis and a flat A wave in pulmonary hypertension.
Apical five chamber view after TOF repair
Apical five chamber (5C) view after TOF repair, showing the patch in the subaortic region where the VSD (ventricular septal defect) was closed. ATL: anterior tricuspid leaflet.
Post TOF repair TR
Tricuspid regurgitation jet (TR) seen after TOF repair, with a gradient of 32 mm Hg, indicating mildly elevated right ventricular pressures. The right ventricular pressure prior to repair would have been equal to systemic pressure. TR jet is depicted below the baseline because the flow is away from the transducer kept at the apex.
Subcostal view showing intact atrial septum
Related Posts


About The Author
Johnson Francis
Former Professor of Cardiology, Calicut Govt. Medical Kozhikode, Kerala, India. Editor-in-Chief, BMH Medical Journal