Inferior wall infarction and LVH by voltage
Inferior wall infarction and LVH by voltage
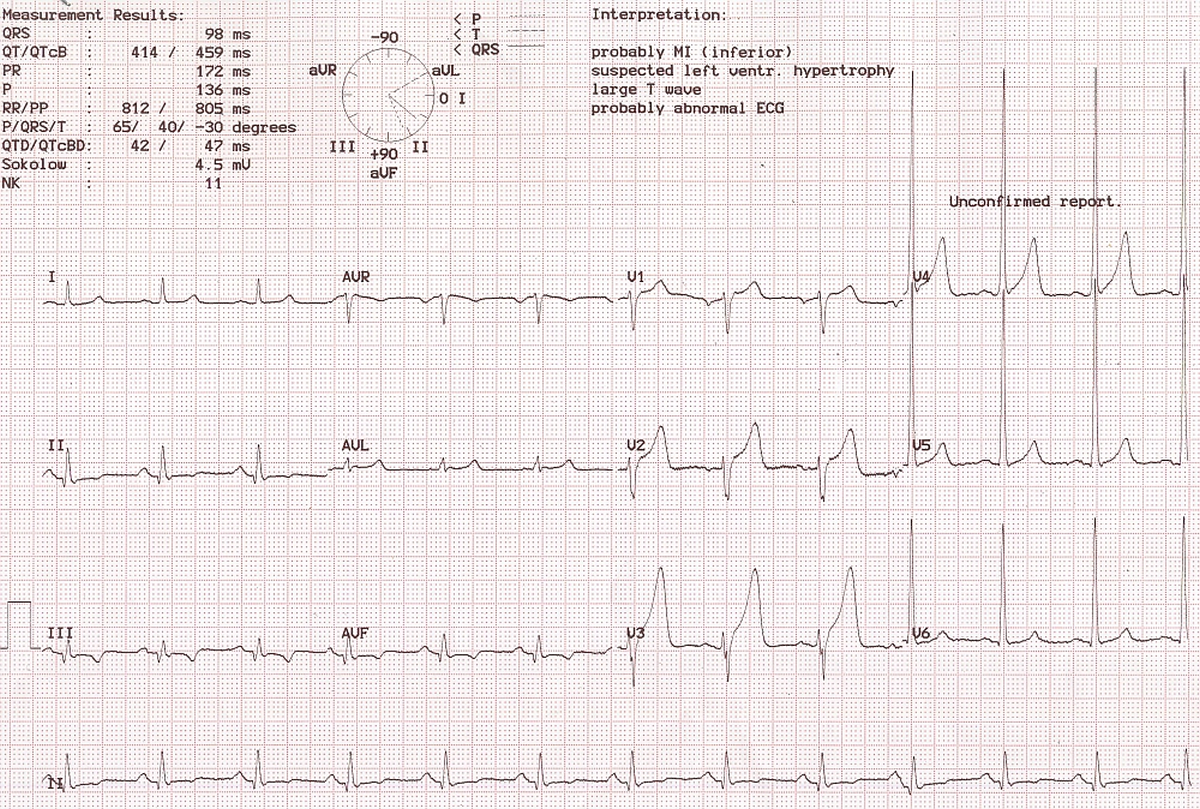
Old inferior wall infarction is manifested as Q waves in II, III and aVF, with T wave inversion. Tall R waves in V4 – V6 suggest left ventricular hypertrophy by voltage criteria. Tall T waves are seen in V2 – V4. Various measured values are seen in the left upper corner. Of interest is Sokolow 4.5 mV, meaning that the sum of S in V1 and R in V5 will be 4.5 mV or 45 mm, indicating LVH by voltage according to Sokolow Lyon criteria. The clock face displays the axes of P, QRS and T waves. Next to that is the automatic interpretation, which is good in this case, though sometimes it might be wrong as well.
Related Posts


About The Author
Johnson Francis
Former Professor of Cardiology, Calicut Govt. Medical Kozhikode, Kerala, India. Editor-in-Chief, BMH Medical Journal