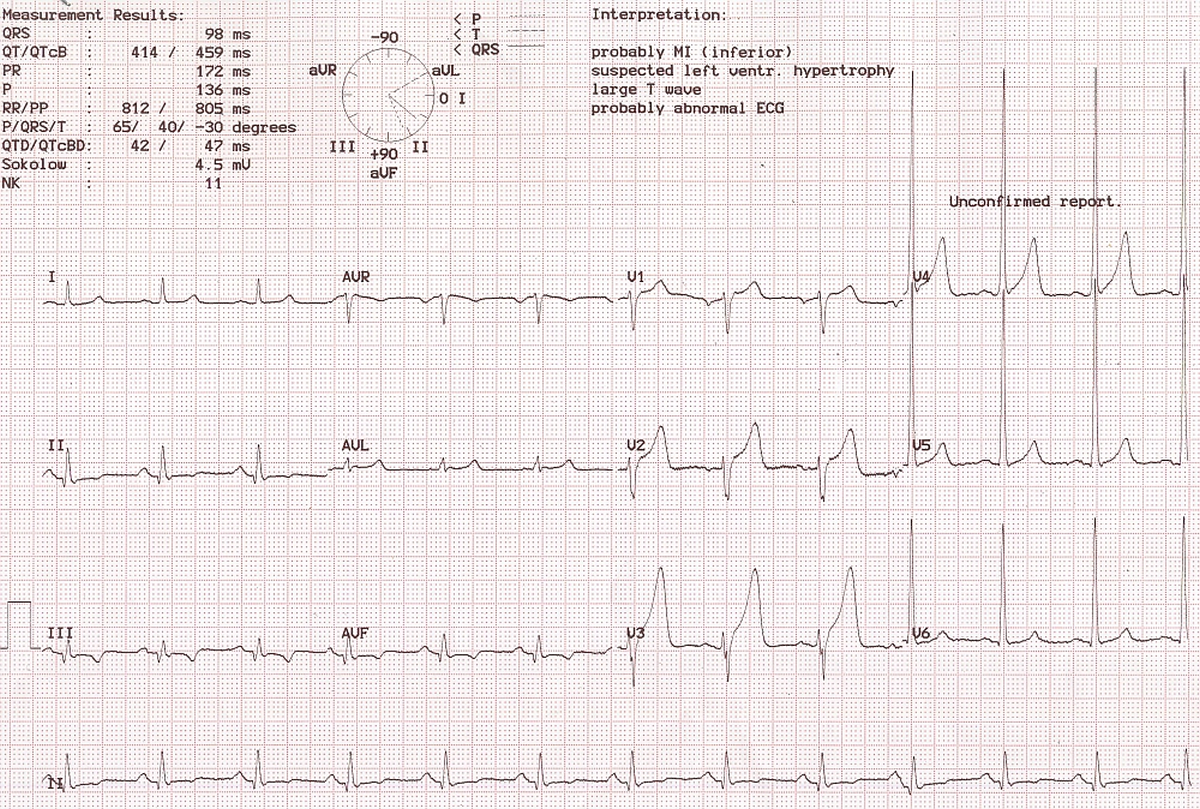
Inferior wall infarction and LVH by voltage
Inferior wall infarction and LVH by voltage

Old inferior wall infarction is manifested as Q waves in II, III and aVF, with T wave inversion. Tall R waves in V4 – V6 suggest left ventricular hypertrophy by voltage criteria. Tall T waves are seen in V2 – V4. Various measured values are seen in the left upper corner. Of interest is Sokolow 4.5 mV, meaning that the sum of S in V1 and R in V5 will be 4.5 mV or 45 mm, indicating LVH by voltage according to Sokolow Lyon criteria. The clock face displays the axes of P, QRS and T waves. Next to that is the automatic interpretation, which is good in this case, though sometimes it might be wrong as well.

