Intermittent LBBB and P Mitrale or Tricuspidale?
Intermittent LBBB and P Mitrale or Tricuspidale?
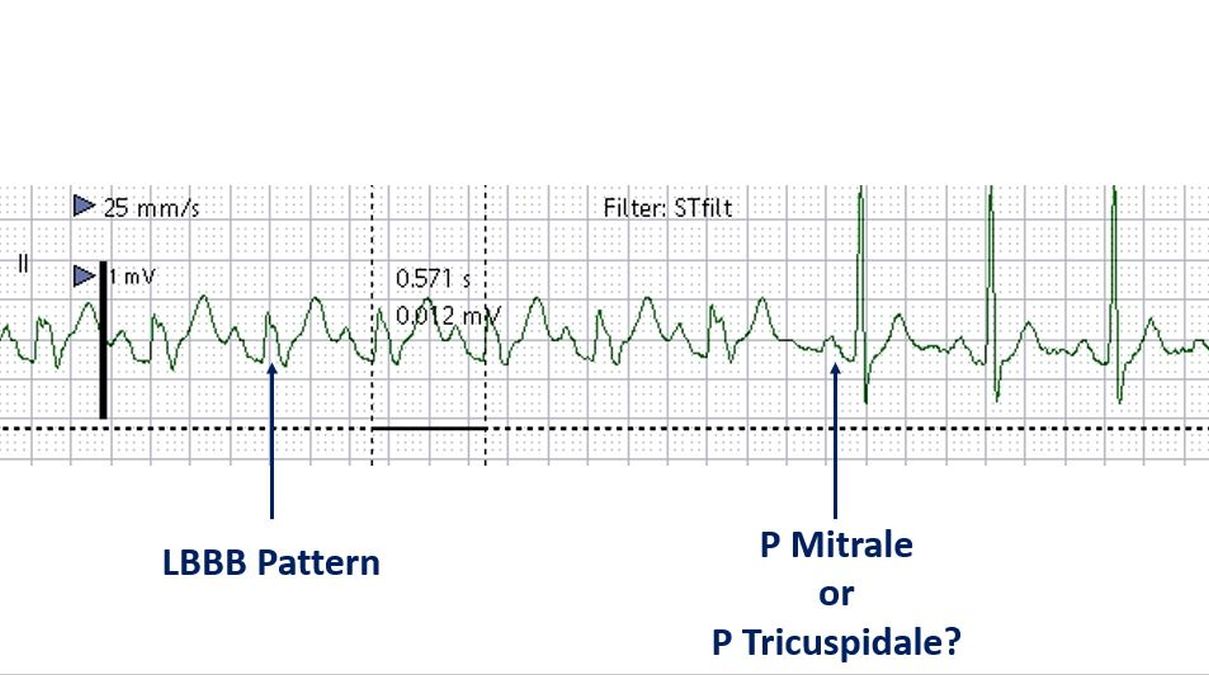
Intermittent left bundle branch block pattern is seen as wide notched QRS complexes with cycle length of 570 ms. Narrower QRS complexes at cycle length of 600 ms are seen towards the end of the tracing. This can be considered as phasic aberrancy which is rate dependent. Classically rate dependent left bundle branch block is deceleration dependent rather than acceleration dependent. Acceleration dependent block is usually right bundle branch block.
P waves are wide and notched, suggesting left atrial overload. But close scrutiny shows that the initial peak is taller than the second peak. In P mitrale we expect the second peak to be taller as left atrial component of P waves is the second part. Here comes the discussion on P tricuspidale, which has a taller first peak in lead II [1,2].
The original description of ‘P tricuspidale’ was by Zuckermann R et al in 1952 [3]. The pattern is a mirror image of the ‘P mitrale‘ in which the second peak is taller. P tricuspidale was noted by Gamboa R and associates in 81% of their 37 patients with tricuspid atresia, while it was seen in only 2 of their 20 patients with pulmonary atresia [1]. In P tricuspidale, the taller initial peak is the right atrial component and the second wider peak is the left atrial component. That is how it indicates biatrial enlargement with preponderance of right atrium.
It may be noted that in pure left atrial enlargement the P wave in lead II is widened, usually with a notch separating the right and left atrial components, but the amplitude of the P wave is within the normal range. In P tricuspidale, both amplitude and duration of the P wave is increased, due to biatrial enlargement. The upper limit of normal width of P wave is 100 ms (2.5 mm with a recording speed of 25 mm/s). The upper limit of normal P wave amplitude is also 2.5 mm (with a standardization of 10 mm per mV) or 0.25 mV.
In the current ECG, the height of the P wave is difficult to ascertain as the baseline is fluctuating. It comes to at least 3 mm if measured from the succeeding PR segment. Though ideally it has to be measured from TP segment, in this case the TP segment is down sloping.
References
- Gamboa R, Gersony WM, Nadas AS. The electrocardiogram in tricuspid atresia and pulmonary atresia with intact ventricular septum. Circulation. 1966 Jul;34(1):24-37.
- Chugh SN. Textbook of Clinical Electrocardiography. Jaypee Brothers Publishers. Page 78.
- Zuckermann R, Cisneros F, Novelo S. El electrocardiograma en 21 topos diferentes de cardiopatias congenitas. Arch Inst Cardiol Mex 22: 550, 1952 (Cited by Gamboa R et al [1]).
Related Posts


About The Author
Johnson Francis
Former Professor of Cardiology, Calicut Govt. Medical Kozhikode, Kerala, India. Editor-in-Chief, BMH Medical Journal