LVOT gradient in HOCM – Doppler echocardiogram
LVOT gradient in HOCM – Doppler echocardiogram
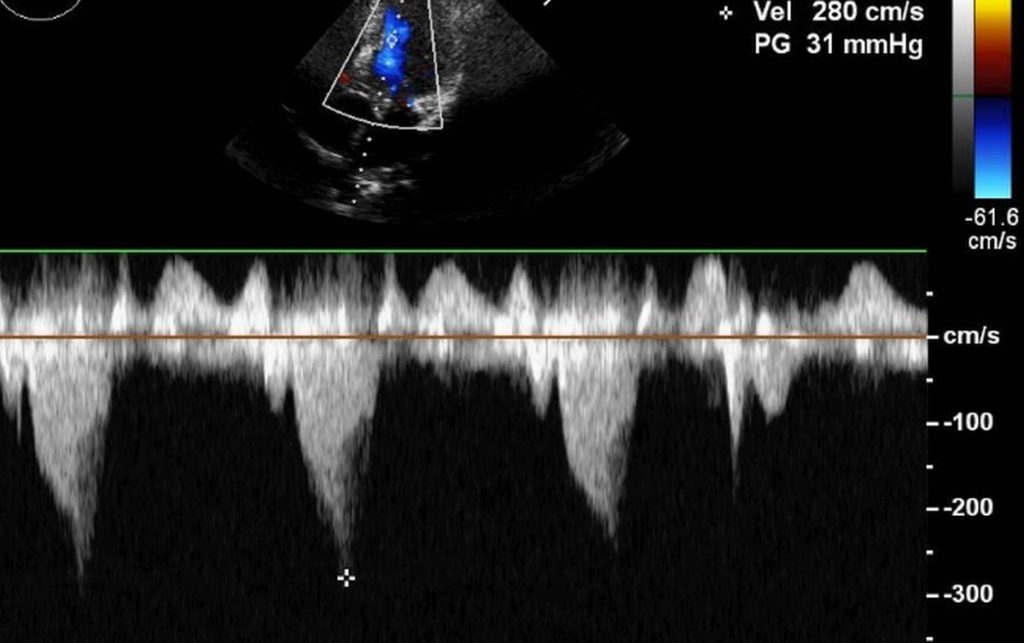
Left ventricular outflow tract gradient (LVOT) in hypertrophic obstructive cardiomyopathy (HOCM) is usually measured from the apical five chamber view (apical 5C) in echocardiography. Initially the apical 5C view is obtained and then the colour Doppler flow mapping (CFM) is done to locate the flow in LVOT. Continuous wave (CW) Doppler cursor is then aligned along the LVOT colour jet of HOCM. The CW jet in HOCM is described as dagger shaped or sickle shaped, unlike the symmetrical tongue shaped jet in fixed obstruction of aortic stenosis. The shape of the jet indicates the dynamic nature of LVOT obstruction in hypertrophic cardiomyopathy. The gradient progressively increases as the systole progresses, to produce this characteristic appearance. The delayed peaking in systole is quite evident (marked by the asterisk).
Dynamic variation of LVOT gradient in hypertrophic cardiomyopathy (HCM)
Dynamic variation of LVOT gradient in hypertrophic cardiomyopathy (HCM) can be quite variable. When the left ventricular cavity is small due to hypovolemia or dehydration, the gradient can rise significantly. Various manoeuvers like isometric handgrip, Valsalva maneuver and standing can bring out the gradient well when it is low in the basal state. But getting a good echocardiographic image during these maneuvers may be challenging.
The dynamic variation in LVOT gradient in HOCM depends on the left ventricular contractility and the loading conditions [1]. These variations depend on the hydration or volume status, activity of the autonomic nervous system, medications being used, physical activity, position during assessment (supine or standing) as well as diurnal variations.
Kizilbash AM et al measured variability of gradient over 5 consecutive days [2]. They demonstrated a variation of +/- 32 mm Hg of resting gradient and +/- 50 mm Hg of provocable gradient. This highlights the fact that a single measurement of LVOT gradient may not adequately quantify the severity of obstruction in HCM. Variation in LVOT gradient of over 40 mm Hg over a three month observation period has been documented Nishimura RA et al [3]. That was an initial randomized double blind cross-over trial of dual chamber pacing in hypertrophic cardiomyopathy.
It may be noted that Doppler measures the peak instantaneous gradient while cardiac catheterisation measures peak-peak gradient between left ventricular and aortic tracings. A good linear correlation between these two has been demonstrated in HOCM [4]. Hence the authors suggested that both gradients can be used to assess the severity of HOCM. They also mentioned that in aortic stenosis, the clinical management should be based on mean gradient as the relationship between peak to peak gradient and peak instantaneous gradient had more scatter.
References
- Geske JB, Sorajja P, Ommen SR, Nishimura RA. Left ventricular outflow tract gradient variability in hypertrophic cardiomyopathy. Clin Cardiol. 2009 Jul;32(7):397-402.
- Kizilbash AM, Heinle SK, Grayburn PA. Spontaneous variability of left ventricular outflow tract gradient in hypertrophic obstructive cardiomyopathy. Circulation. 1998;97:461–466.
- Nishimura RA, Trusty JM, Hayes DL, Ilstrup DM, Larson DR, Hayes SN, Allison TG, Tajik AJ. Dual-chamber pacing for hypertrophic cardiomyopathy: a randomized, double-blind, crossover trial. J Am Coll Cardiol. 1997 Feb;29(2):435-41.
- Geske JB, Cullen MW, Sorajja P, Ommen SR, Nishimura RA. Geske JB, Cullen MW, Sorajja P, Ommen SR, Nishimura RA. Assessment of left ventricular outflow gradient: hypertrophic cardiomyopathy versus aortic valvular stenosis. JACC Cardiovasc Interv. 2012 Jun;5(6):675-81.
Related Posts


About The Author
Johnson Francis
Former Professor of Cardiology, Calicut Govt. Medical Kozhikode, Kerala, India. Editor-in-Chief, BMH Medical Journal