Left Bundle Branch Block and Gressard’s Hypothesis
Left Bundle Branch Block and Gressard’s hypothesis
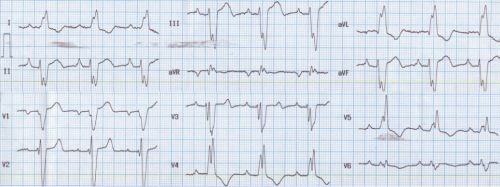
ECG shows left bundle branch block pattern as evidenced by the wide notched QRS in leads I, aVl and V5, as well as the slurred QS complex in V1. In addition there is left axis deviation of QRS in this ECG.
Gressard A [1] electrophysiologically evaluated 69 patients with LBBB, of which nine had left axis deviation with QRS axis of -60 degrees. From the results of stimulation at right ventricular apex, the starting point of ventricular depolarization, he hypothesised that LBBB should have a monomorphic morphology with QRS axis of -60 degrees and QS in leads II and III. If not, the left bundle branch has slowed, but has persistent conduction. This has been called the Gressard’s hypothesis.
Parharidis G et al [2] also studied the importance of left axis deviation in LBBB. They concluded that the presence of left axis deviation in LBBB had a 41.9% sensitivity and 91.6% specificity for the presence of organic heart disease.
Cabrera’s sign is a notching in the in the ascending limb of the S wave in lead V3 or V4 (0.04 seconds). Chapman’s sign is a notching ≥ 0.05 sec in the ascending limb of the R wave in lead I, aVl or V6. Both are taken as features of myocardial infarction in the presence of LBBB.
This ECG also shows a PR interval of 0.2 seconds, sharp P waves in lead II suggesting right atrial overload and prominent negative P waves in V1 suggestive of left atrial overload.
References
- Gressard A. Left bundle branch block with left-axis deviation: an electrophysiologic approach. Am J Cardiol. 1983 Nov 1;52(8):1013-6.
- Parharidis G et al. Complete left bundle branch block with left QRS axis deviation: defining its clinical importance. Acta Cardiol. 1997;52(3):295-303.
About The Author
Johnson Francis
Former Professor of Cardiology, Calicut Govt. Medical Kozhikode, Kerala, India. Editor-in-Chief, BMH Medical Journal