Giant T inversion and NSVT
Giant T inversion and NSVT
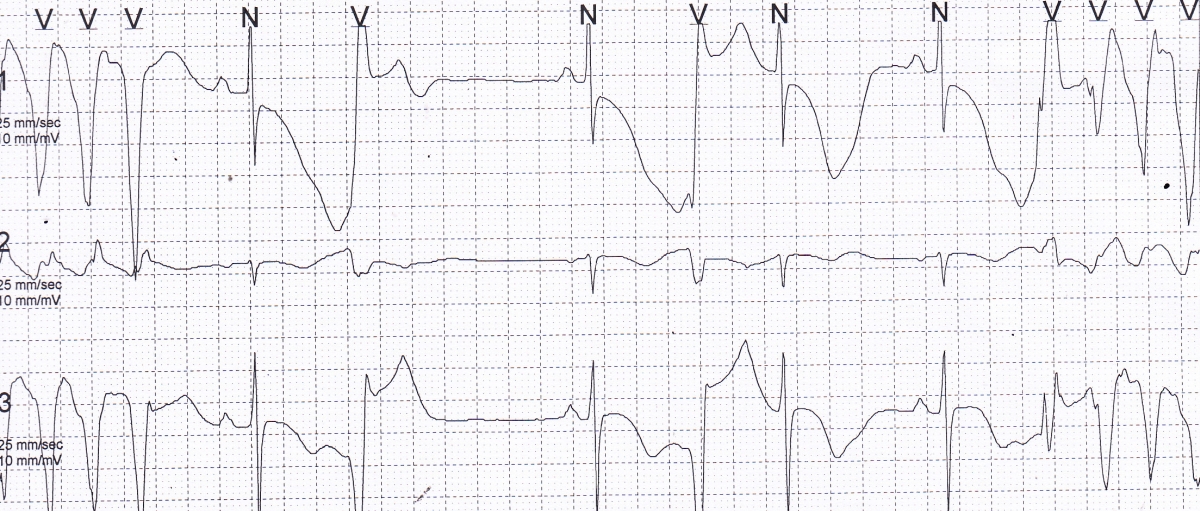
Holter tracing showing giant T wave inversion and non sustained ventricular tachycardia, both at the beginning of the tracing and at the end. Ventricular ectopic beats are also seen in between. Variation in QRS amplitude of the NSVT beats are evident. It is likely that this will soon progress to torsades des pointes in the setting of gross QT interval prolongation. QT interval is seen as 640 ms in a cycle with cycle length of 600 ms. So, the QTc will be 640 ms. The first ventricular ectopic is followed by a good compensatory pause while the second one is almost an interpolated ventricular ectopic beat. Initial beat of the NSVT in the terminal part of the strip has a different morphology and the cycle length to the next beat is longer. It is 360 ms compared to 280 ms for the other NSVT beats. Channel 1 shows ST segment depression in the sinus beats.
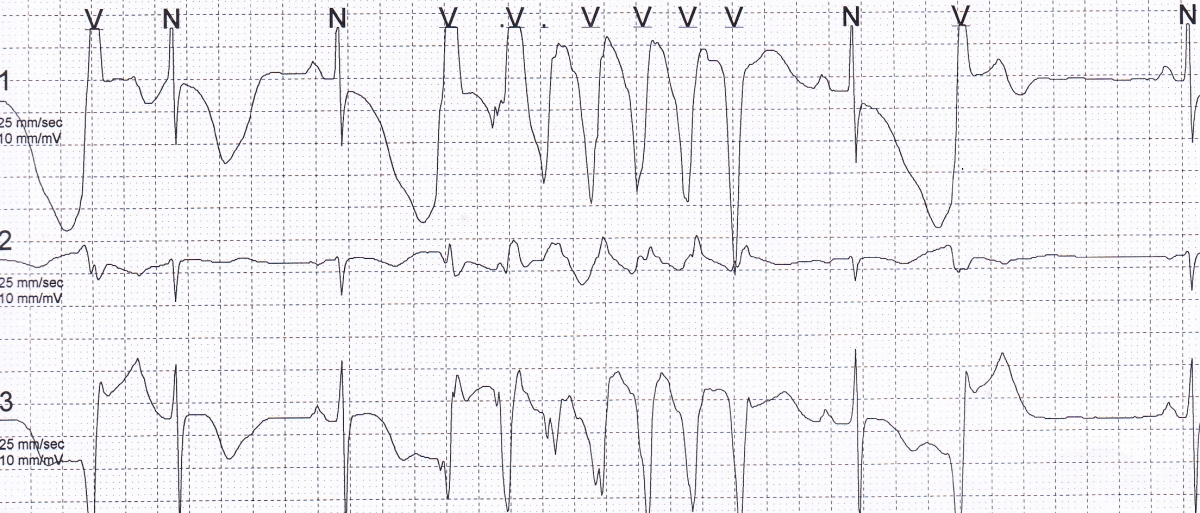
Another Holter strip showing NSVT, giant T inversion and QTc prolongation. Here the polymorphic nature of the NSVT is more evident, though it is yet to evolve into the typical torsades des pointes. Isolated VPCs are also seen. The VPC at the beginning of the tracing is not followed by a compensatory pause. The PR interval of the next beat is prolonged, suggesting concealed retrograde conduction of the VPC in the atrioventricular junction. The next sinus beat also has a shorter QTc and less deep T inversion, possibly due to the shorter preceding cycle length. The last VPC in the tracing has a good compensatory pause. Channel 1 shows ST segment depression in the sinus beats.
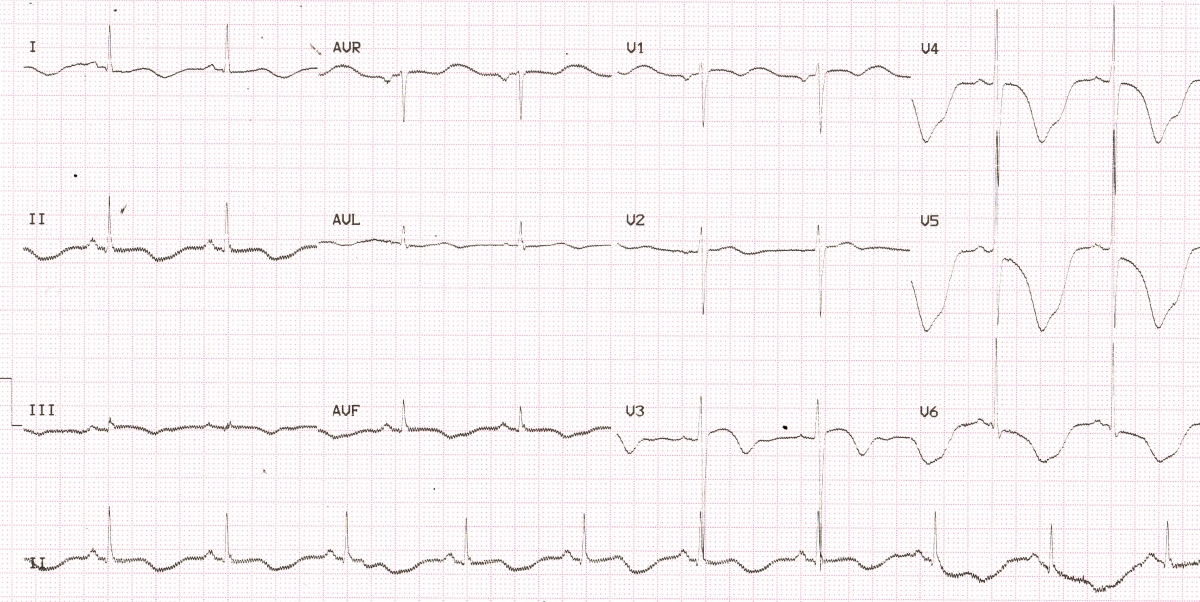
Baseline ECG showing giant T wave inversion in lateral leads. Coved ST segment is seen in V3. QT interval is 680 ms at a cycle length of 600 ms, which will be the QTc. ST segment depression is noted in V5 and V6. Shallow T inversion is seen in inferior leads. 50 Hz line voltage artefacts are seen in almost all leads, but more prominent in inferior leads. No ventricular ectopy has been documented in this tracing, showing the importance of longer monitoring to document arrhythmia. Maximum depth of T wave inversion in V5 is 18 mm.
A depth of T wave of 10 mm or above is generally considered as deep T inversion [1]. Giant T wave inversions with depth of 35 mm have also been described in literature [2]. Deep T inversions without gross increase in width can occur in ischemia and hypertrophic cardiomyopathy. In a study involving 864 patients with hypertrophic cardiomyopathy, 15% had giant T wave inversion [3].
Deep and wide negative T waves are an important feature of post anoxic state and occurs typically after a Stokes-Adam attack. Presence of such broad and negative T waves in a case of complete heart block would indicate that the person had a recent episode of asystole.
Giant wide T inversion can occur in intracranial bleeds like subarachnoid hemorrhage. Giant T wave inversion has been reported in pheochromocytoma, after electroconvulsive therapy [1] and Takotsubo cardiomyopathy [4]. Giant T wave inversion can also occur with cardiogenic, but non ischemic pulmonary edema, associated with prolongation of QT interval and resolving after resolution of symptoms [5].
References
- Said SA, Bloo R, de Nooijer R, Slootweg A. Cardiac and non-cardiac causes of T-wave inversion in the precordial leads in adult subjects: A Dutch case series and review of the literature. World J Cardiol. 2015 Feb 26;7(2):86-100.
- Yue-Chun L, Lin JF. Rare giant T-wave inversions associated with myocardial stunning: report of 2 cases. Medicine (Baltimore). 2014 Jun;93(4):e39.
- Kim SH, Oh YS, Nam GB, Choi KJ, Kim DH, Song JM, Kang DH, Song JK, Kim YH. Morphological and Electrical Characteristics in Patient with Hypertrophic Cardiomyopathy: Quantitative Analysis of 864 Korean Cohort. Yonsei Med J. 2015 Nov;56(6):1515-21.
- Yaguchi M, Yaguchi H, Takahashi N. A case of asymptomatic takotsubo cardiomyopathy with intraventricular thrombus associated with epileptic seizure. Brain Nerve. 2011 Aug;63(8):897-900.
- Littmann L. Large T wave inversion and QT prolongation associated with pulmonary edema: a report of nine cases. J Am Coll Cardiol. 1999 Oct;34(4):1106-10.
Related Posts

About The Author
Johnson Francis
Former Professor of Cardiology, Calicut Govt. Medical Kozhikode, Kerala, India. Editor-in-Chief, BMH Medical Journal