Normal ECG
Normal ECG
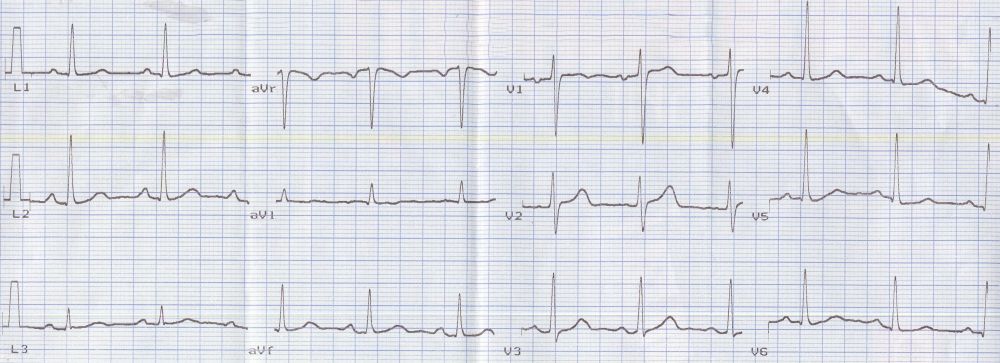
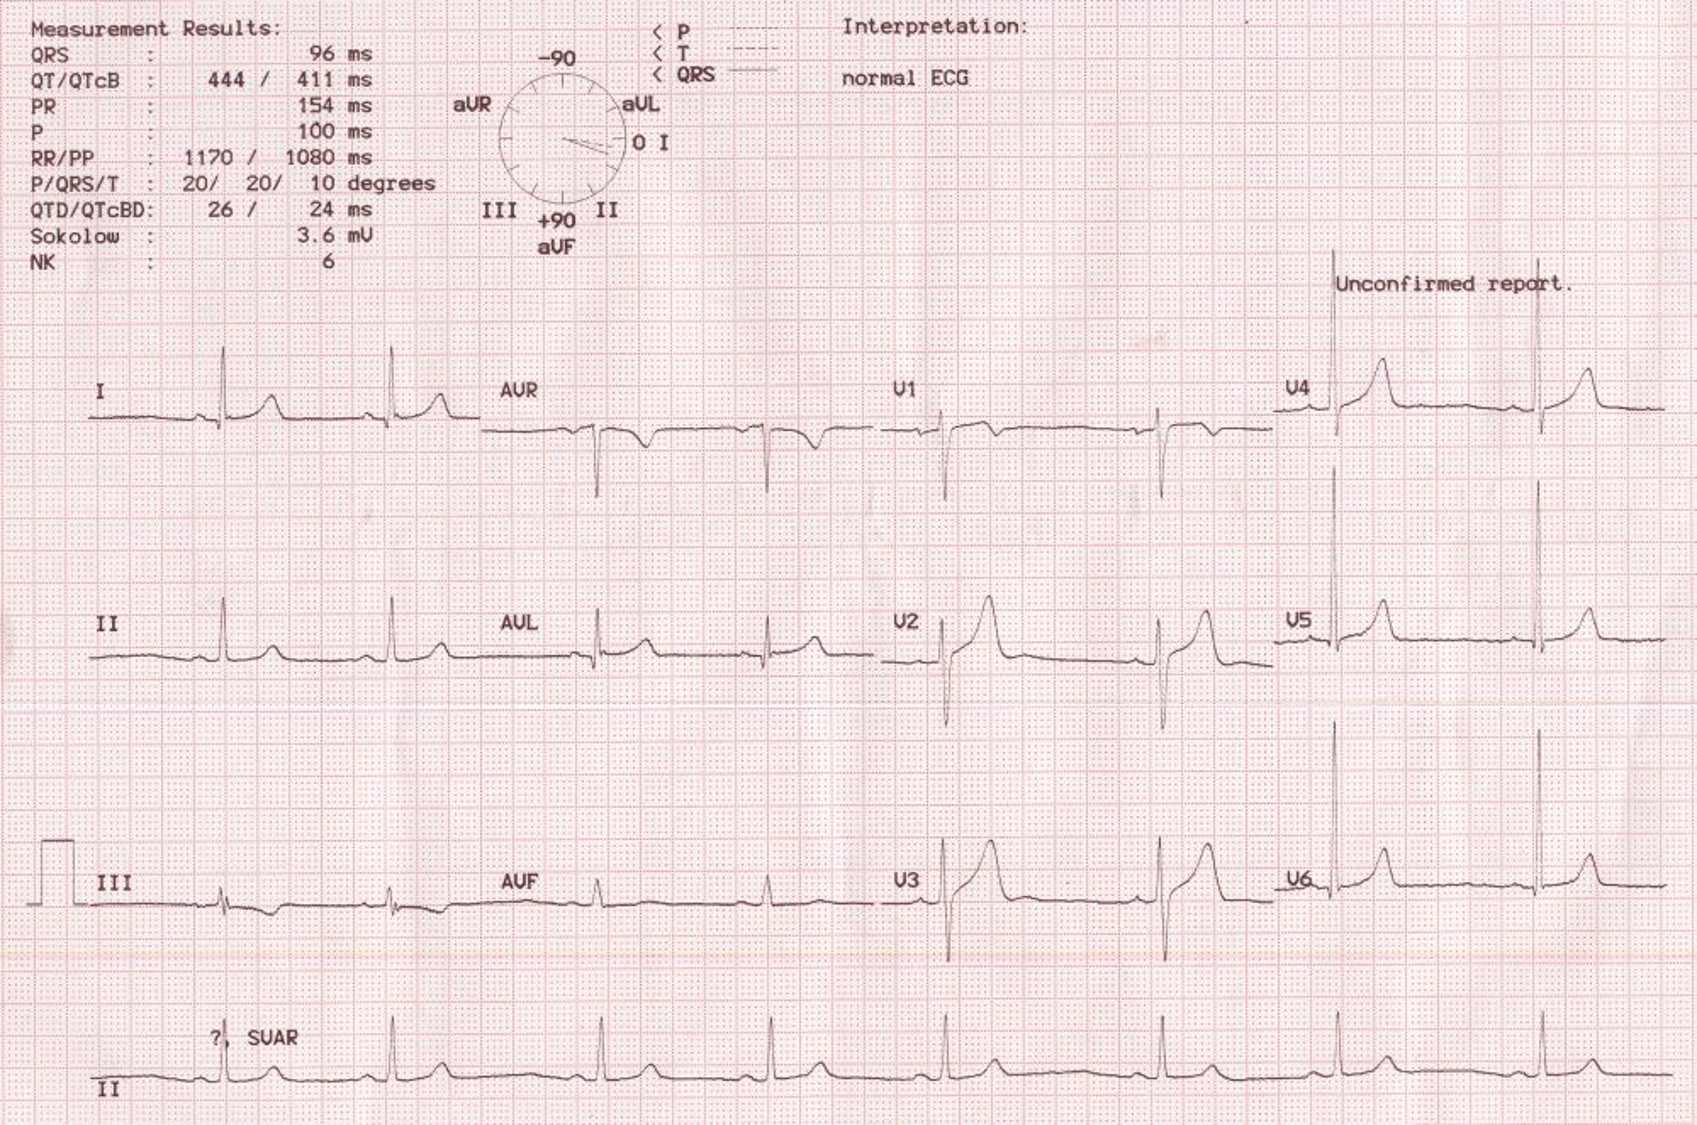
This tracing shows a normal ECG with sinus rhythm at about 75 per min. Sinus rhythm is identified as a narrow QRS rhythm with P waves preceding each QRS complex with a fixed and normal PR interval in the range of 120 to 200 msec. P waves in sinus rhythm are positive in leads I, II and III. In abnormal atrial rhythms, P wave axis changes. For example, in low atrial or coronary sinus rhythm, the P waves are inverted in leads II, III and aVf. rS pattern in V1 and qR pattern in V6 are the usual pattern in chest leads (Capital letters are used for large amplitude components of the QRS complex and small letters are used low amplitude components). R and S are almost equal in amplitude in V2 and Rs pattern is seen in V3. Here the transition from rS pattern to Rs pattern occurs in V2. T waves have the same direction as the dominant QRS direction. Hence T waves are inverted in aVr and sometimes in V1 in a normal ECG.
Normal P wave duration is less than or equal to 100 msec and amplitude is less than or equal to 0.25 mV. QRS duration is up to 110 msec. QT interval varies with the heart rate and a correction for the heart rate is obtained corresponding to a heart rate of 60 min and called the corrected QT interval or QTc. ST segment is isoelectric in most leads though minor ST segment elevation can be seen in leads V1 and V2. This is usually an upsloping ST segment elevation merging smoothly with the T wave. TP segment / interval is the true isoelectric interval in a normal ECG and is the level to which elevation or depression of other segments have to referenced. But baseline fluctuations may sometimes make it useless as a reference as in this case in lead V4. Although there is an apparent ST segment depression is seen in the second complex in lead V5, it is due to baseline fluctuation as evidenced by the still lower position of the following TP segment.
There is a gradual progression of QRS amplitude from V1 to V5. This progression is lost in myocardial infarction of the anterior wall of the left ventricle. R wave amplitude in V6 is usually lesser than that in V5. Small initial q waves are normally seen in V5 and V6 and represents the normal initial left to right activation of the interventricular septum. Hence it is lost in left bundle branch block. The initial septal q waves become deeper in left ventricular volume overload. Prominent septal Q wave are seen in hypertrophic cardiomyopathy with asymmetric septal hypertrophy.

About The Author
Johnson Francis
Former Professor of Cardiology, Calicut Govt. Medical Kozhikode, Kerala, India. Editor-in-Chief, BMH Medical Journal