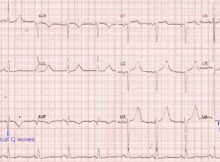
Old inferior wall infarction and lateral ST depression ECG shows sinus rhythm at around 75/min, with pathological Q waves in inferior leads, indicating old inferior wall myocardial infarction.
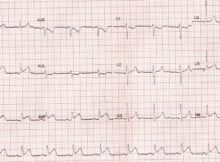
Evolved anterior wall myocardial infarction ECG shows sinus rhythm at a rate of around 100/min, with QS complexes in anterior leads along with a coved ST segment elevation
Pacing in complete heart block – ECG Pacing in complete heart block (CHB): Initial part of the ECG shows narrow QRS complexes at a rate of around 43/minute.
Artifacts resembling ventricular tachycardia and fibrillation Artifacts in an ECG can mimic various pathological conditions. In V1, multiple small artefacts almost totally obscure the small QRS complexes so
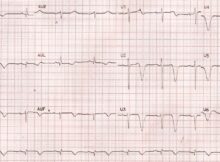
Deep T inversion First few conditions which come to our mind when we see deep T wave inversions are: Coronary artery disease Hypertrophic cardiomyopathy Post cardiac arrest state
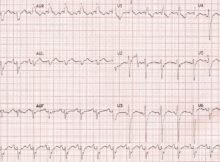
Inferolateral myocardial infarction ST segment elevation is seen in inferolateral leads (II, III, aVF, V5, V6) indicating inferolateral ST elevation myocardial infarction (STEMI). There is a discordance between
Right bundle branch block with right upper quadrant axis ECG demonstrating right bundle branch block with right upper quadrant axis: rsR’ pattern in V1, rS pattern in I,